How Many Wins Does a Great Fielder Give a Team?

Recently we examined the impact at a team level of fielding, finding that, with everything else being equal, fielding can have a huge impact on a team’s win total. This is true even at fielding levels comparable to what we see in MLB.

It only follows to take it a step further and do the same thing at a positional level. Of course a slick-fielding shortstop should be more valuable than other positions (again, all else being equal).

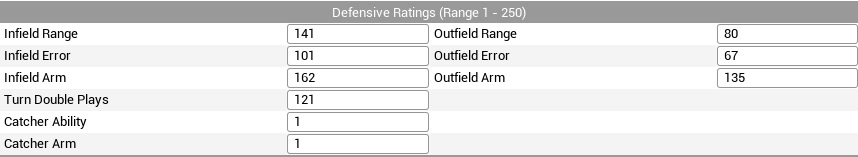
So we followed a similar methodology as we did in our team-level analysis, except that we used only two teams: a control team and an experimental team. Again using OOTP 16, we built both teams by making clones of one player and one pitcher with average ratings – including average fielding ratings. We then modified one positional player on the experimental team and optimized their relevant fielding ratings, and only gave them experience in the position of interest to keep the AI manager from using them in different positions. Player development and injuries were turned off.

We then simmed five 162-game seasons to see what benefit having the optimized fielder had on the team’s chances of winning, and tracked the fielding stats for each.
Below is the impact on a team’s win total based on those five seasons. Granted there is some noise in the data (we could sim it 1000 times per position to reduce the noise, but hey, we’re not getting paid for this). Also, it turns out the single position player we cloned was a lefty, and all pitchers were righties, so there is a strong bias towards position players on the right side of the diamond. Again, we could correct for this if someone wanted to pay us.

Fielding results

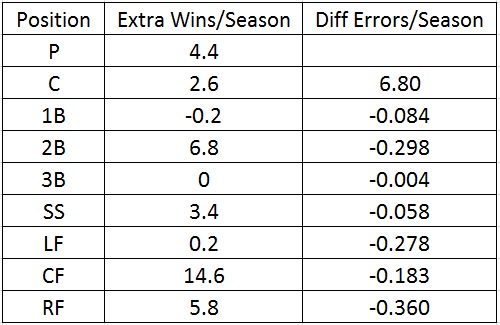
The glaring finding is the importance of a superior defending center fielder. The ability to get to balls in the gap to take away extra base hits turns out to provide more than twice as many extra wins per 162 games as any other position.

The other finding is that with the exception of catchers, all superior fielders had MORE errors per season than their average fielding counterparts. The logic being the got to more balls in play and therefore had more opportunities for errors.

Again this is only looking at the benefit of a great fielder compared to an average one. It would be different to look at a situation like Yasmany Tomas and the D’backs decision to put his less-than-stellar defense in at third, and the impact of a terrible fielder on team wins.

Exploring the Impact of Fielding on Wins

We’ve previously used Out of the Park Baseball (OOTP) to test out theories on hitting, such as how well OPS and Runs Created predict team win totals. The sabermetrics folk have made great strides in trying to create meaningful statistics for fielding, including Ultimate Zone Rating (UZR), Total Zone (TZ), and Defensive Runs Saved (DRS). We won’t go into great detail about what each of those do – FanGraphs does a better job than we ever could. But it’s not as easy to take the results of any of these statistics and translate it to what matters most – a player’s contributions to a team’s win total.

Baseball Reference does include DRS into its WAR calculations, but there’s always a danger when we’re extrapolating one step beyond any one particular calculation. For instance, DRS provides an estimate of runs saved which is then used in a calculation to estimate how many additional wins you might expect. But each of those calculations will have an error range and will be impacted by a myriad of other factors. We were looking to use OOTP for a more direct way to see how fielding impacts a team’s win total.

Our first foray simply looked at teams with different overall fielding capabilities. OOTP uses several different ratings for fielding, available when editing player characteristics. For instance for an infielder there is Infield Range, Infield Error, Infield Arm, and Turn Double Plays. Each rating is based on a scale of 1-250.

OOTP Fielding

We set up an 11-team league, with each player on each team having the same overall fielding ability but with each team varying in their abilities. So for instance one team had each player with a “1” rating for each fielding ability, while another team had each player with a “250” for each fielding ability. All players had the same league average ratings for hitting. All pitchers were equivalent pitchers with average ratings, and an average ground/fly ratio.

We simmed three seasons (with all injuries and player development turned off). Of course, the better fielding teams did better, but it was somewhat surprising as to how much better they did. The team made up of the highest rated fielders average a record of 113-49 with the team made of the lowest rated fielders went and average of 42-120.

What was also interesting were the number of errors committed per game. The best fielding team committed only .28 errors per game with the worst fielding team 1.31. We would have thought with everyone on the team having a 1 rating for every fielding attribute that they would have kicked and thrown the ball around more. But they still on average gave one extra out to the other team than the best fielding team. By comparison in 2014 the Reds had the fewest errors (.62 errors/game) while the Indians had the most (.72 errors/game).
The more important difference seemed to be in balls the fielders didn’t get to due to range issues. Defensive efficiency for the best fielding team was .768 while for the worst it was .606. In 2014 the best team DEF was .712 by the Reds and the worst was .672 by the Twins.

So let’s try to extrapolate this to some meaningful MLB differences. Since the original league took fielding ratings to extremes, we created a league with teams whose defensive ratings more closely resembled MLB. In this 9-team league, fielding ratings for all players ranged between 115 and 155 (the range in the original sim which more closely resembled MLB fielding stats).

Again we simmed three seasons, and the difference between the first and last place teams was again quite large. The top fielding team went on average 92-70 while the worst fielding team went 71-91 – a whole 21 game difference. Here are the results:

Final stats

Along with charts for errors/game compared to wins and team DEF compared to wins.

Def and wins

Errors per game

There are certainly many factors that can influence these results – most notably around balls hit in play (e.g. increased strikeout rate, HR %). But this certainly does suggest that getting a good grasp on accurately rating fielders can have a big impact on a team’s win total.