Category Archives: OOTP

What if it was Called Sandy Koufax Surgery?

Sandy Koufax was one of the most dominant pitchers in the history of baseball, and at the age of 36 was the youngest to ever be enshrined in the Hall of Fame.

Koufax 
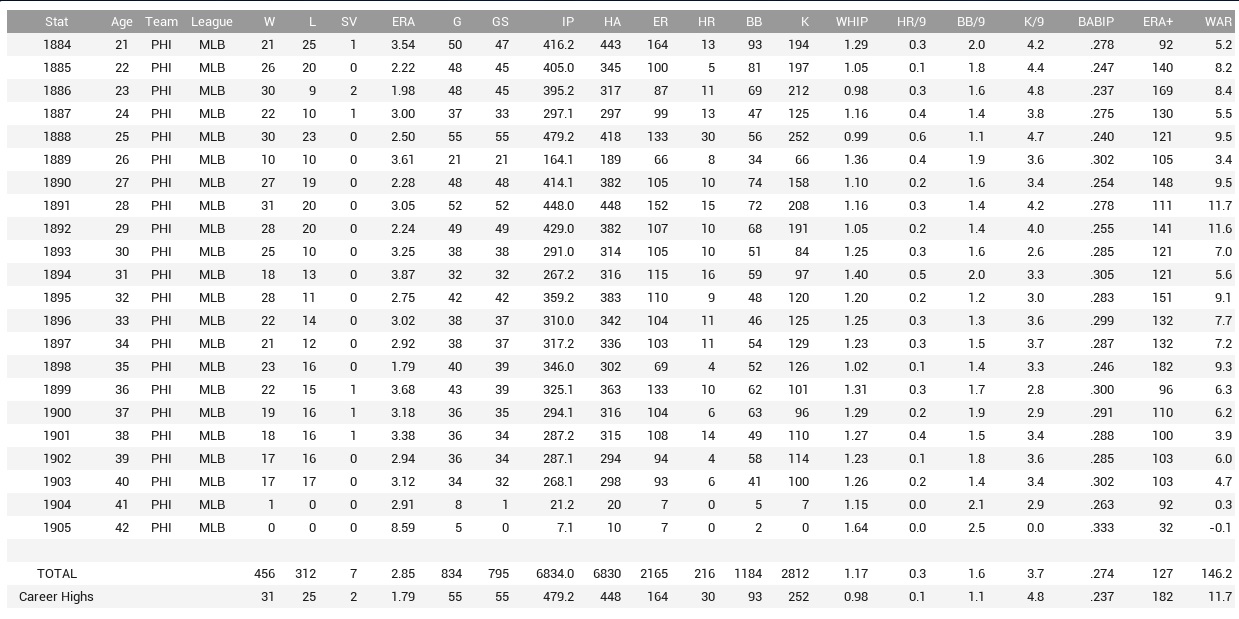
(Source: Baseball-Reference.com)

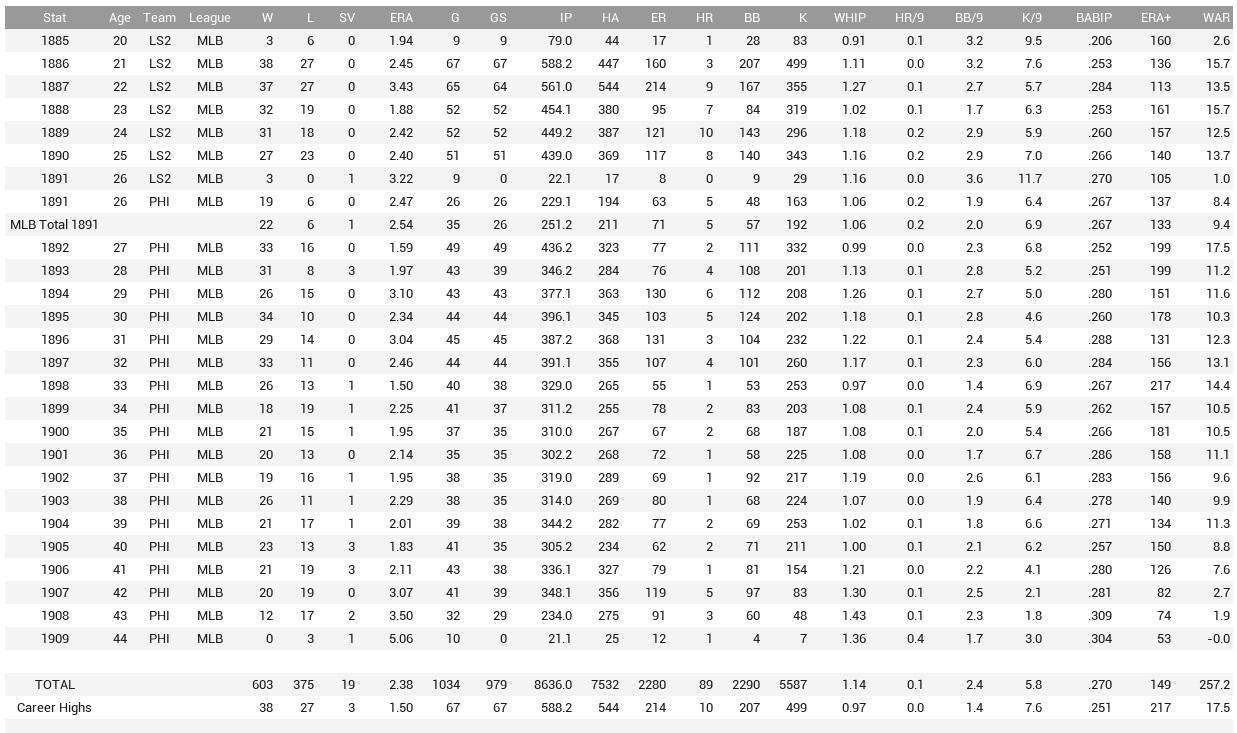
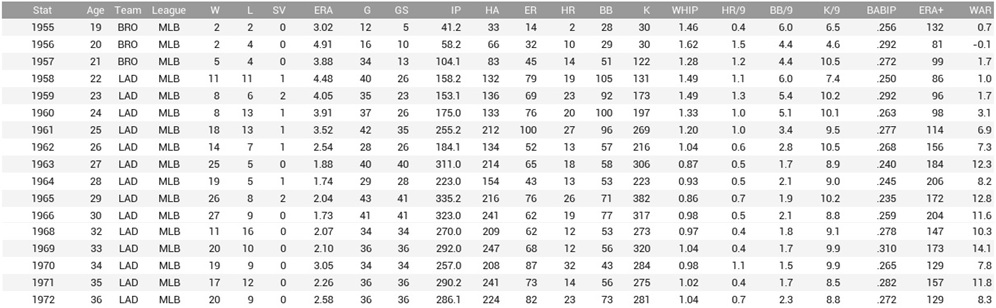
The reason for his enshrinement at such a young age was due to his early retirement due to an arthritic condition in his elbow. He pitched the entire ’65 and ’66 seasons in extreme pain but still dominated, pitching over 320 innings in both seasons going a combined 53-17 with 699 strikeouts – and winning the Cy Young both years.

Koufax retired shortly after the 1966 World Series at the age of 30.

Dr. Frank Jobe once said that Koufax had basically the same injury as Tommy John, and that if he had developed the pioneering surgery ten years earlier (Dr. Jobe was already 41 by the time Koufax retired) the surgery would likely have been named after Koufax instead.

We always find it interesting to play out these “what if” scenarios that abound in baseball, so naturally we wanted to see what might have happened if Sandy Koufax had been able to extend his career.

As always, we used OOTP16, starting a historical league on January 1, 1967. In this world, Koufax became the pioneer for the ligament replacement surgery. Having undergone the surgery immediately after the ’66 World Series meant Koufax would likely be ready to play again by the beginning of the ’68 season.

Without Koufax, the ’67 Dodgers slipped back as their offense struggled, finishing the season 82-80, 17 games back of the Cardinals. But it was their hitting instead of Koufax’s absence that was the major reason, as the Dodgers hit a collective NL worst .236 with a lowly .627 OPS.

Koufax was ready to take his rightful place as the ace of the staff at the beginning of the ’68 season. His first start on Opening Day was against the Phillies. Whether rust or nerves got the best of him, he gave up 3 hits, a walk, and 3 runs in the opening frame. He settled down after that, giving up 7 hits over the final 8 frames for a complete game, but the damage was done and the Dodgers lost 3-2.

A no-decision and a tough luck 1-0 loss dropped him to 0-2 before Koufax really caught his groove, throwing 23 straight scoreless innings. He would improve his record to 4-3 before arm troubles would once again strike. He missed two starts with inflammation and struggled once he came back, uncharacteristically dropping 5 straight decisions, including 2 in which he gave up 5 earned runs. But he bounced back with a complete game shutout of Cincinnati to go into the All-Star break. Despite a 5-8 record, his 2.17 ERA, 0.98 WHIP, and 5.2 WAR was good enough for a spot on the All-Star team.

Meanwhile the Dodgers were rebounding from their lackluster ’68 season and were leading the NL at the break – but 5 other teams were within 4.5 games.

Right after the break Don Drysdale wrecked his elbow and would miss the remainder of the season. Without Drysdale and with a completely anemic lineup, the Dodgers couldn’t hold it together in the second half. They plummeted down to 6th place, 10 games behind the NL champion Phillies.

Koufax finished his comeback season with everything except his W-L record resembling his prior dominant years. He ended 11-16, but with a 2.07 ERA, 273 Ks in 270 IP, and a 10.2 WAR. He led the league in strikeouts, WAR, complete games (18), and shutouts (7). Voters didn’t hold his record against him, as he won his 4th Cy Young award.

In ’69 with the new NL alignment, the Dodgers still couldn’t quite get it altogether. Shortcomings at the plate were not addressed during the offseason and Drysdale would miss the entire season as well. Though they finished with a winning record (87-75) the Dodgers finished only 4th in the new NL West, 15 games behind the Astros.

Koufax was still in prime form, however. He finished the season especially strong, going 8-1 over his final 10 starts, 6 of which were complete games. Even with the higher pitching mounds introduced in ’69, at no point during the entire season was his ERA over 2.66. Once again he led the league in strikeouts (320) and WAR (14.0), going 20-10 overall with a 2.10 ERA. He would win both the Cy Young and MVP Award in that season.

The 1970’s arrived and the now 34-year old Koufax wasn’t losing a single step. Again he led the Dodgers’ pitching staff and dominated opposing hitters. A mid-August swoon where he gave up 26 ER over 5 starts was the only blemish, though that period was attributed to some lingering arm issues which caused him to miss 2 starts. Once he returned he went back to his old form, winning his last four decisions.

With Drysdale back, the two of them anchored the pitching staff. The previously anemic Dodgers lineup was bolstered by the production of Al Herrera, who hit 24 HR, a young Steve Garvey, and the acquisition of Earl Williams as the number one catcher, who smashed 40 HR. With all the pieces in place, the Dodgers won the NL West, going 92-69.

Koufax and the Dodgers would face the Phillies for the NL Championship, with Koufax pitching game 1 against Rick Wise. Wise outperformed Koufax pitching 7 shutout innings of 5-hit ball in a 3-0 win. The teams would split the next two before Wise and Koufax would square off again with the Dodgers facing elimination. This time Koufax came out on top 3-2, thanks to a two-run HR from Williams. Drysdale would finish them off in the 5th game and the Dodgers went on to face the Tigers in the World Series.

Koufax was excellent in his first World Series start since 1966, pitching a complete game 4-hitter with a sac fly as the only run scored. Unfortunately for him, the Tigers had acquired Jerry Reuss who pitched a shutout and the Dodgers lost 1-0. Once again the teams would split the next two games and Koufax would face Reuss in Game Four. Koufax pitched another complete game winning 5-1. The teams would again split the next two games setting up another Koufax/Reuss matchup for the 7th and decisive game.

Koufax cruised through the first 3 innings but in the 4th was forced to exit the game as his arm acted up yet again. The bullpen pitched admirably but a solo shot by Jim Spencer in the 5th was the only run of the game and the Tigers blanked the Dodgers to win the World Series. For Koufax it was a heart wrenching end to an otherwise brilliant season.

1971 was another down year for the Dodgers – their worst since 1958 winning only 75 games. There was one bright spot, which occurred on July 21st. Koufax took the mound and pitched a complete game 7-hitter against the Reds to win his 200th career game. He finished that season 17-12 with a 2.26 ERA and 11.9 WAR, good enough for his 6th Cy Young.

He would win 20 games again in 1972 to go along with a 2.58 ERA and an 8.3 WAR. On October 3rd he took the mound against the Atlanta Braves who got to him early and often. While he stuck it out to go 7 innings, he tied his career high by giving up 9 earned runs. That outing was topped off by a 2-run HR by Hal McRae. It would be the last pitch Koufax would throw, as he retired at the end of the season at age 36.

Coming back from Tommy John surgery extended Koufax’s career 5 full seasons and allowed him to reach the 200-win milestone along with winning 3 more Cy Youngs and one more MVP. He finished 252-143 with a 2.62 ERA and a career 116.8 WAR. While Koufax certainly wasn’t the only factor, he contributed to giving the Dodgers one extra NL championship than they did in real life, but his arm let him down in the most important game.

Koufax Stats

So would Koufax coming back have positively or negatively affected his legacy? He still didn’t rack up 300 wins, but his 6 Cy Young Awards would today be second only to Roger Clemens (7) – a number made more impressive by the fact that before his injury it was a combined AL/NL award. Add to that the likelihood that Tommy John surgery would have been called Sandy Koufax surgery makes us wish Dr. Frank Jobe had developed his groundbreaking surgery earlier.


Follow us on Twitter @BullpenByComm

Why Babe Ruth Should Have Hit Leadoff

Most baseball fans have a good handle on what type of hitter should in which spot in the batting order. For instance, a speedster should hit leadoff, your big slugger hitting cleanup, etc. Tom Tango, Mitchel Lichtman, and Andy Dolphin in their book “The Book” provided statistical analysis to optimize a batting order. They based their analyses on the number of plate appearances and the frequency of base/out states (e.g. how often the cleanup hitter comes to bat with runners in scoring position).

I won’t go through all the explanation as Tango, Lichtman, and Dolphin did a much better job. If you don’t want to read the original source, Beyond the Box Score did a great job providing an overview and Bluebird Banter went through some of the statistical analysis.

We wanted to see how that analysis would transfer to actual wins and losses. We looked at two scenarios using the greatest leadoff hitter, Rickey Henderson, and the greatest hitter of all-time, Babe Ruth.

As we normally do, we used OOTP16 and created 9 teams filled with average clone position players and pitchers. Then we imported the 1982 version of Rickey Henderson and cloned him to make nine Rickey’s – one for each team. For each team, he hit in a different spot in the batting order (including the ninth spot – there was no DH in this league so the pitcher batted eighth on that team).

Then we simmed almost 2000 games for each team, and (WARNING!!!! MATH TERM!!!) checked the binomial probability of each winning percentage to see if it was significantly different than what you might see flipping a coin 2000 times.

Here are the winning percentages for when Rickey hit in each spot in the lineup and the result of the binomial distribution calculation:


Henderson

All values were not significantly different from a coin flip (a value of less than .050 would have meant they lost more significantly more games and a value greater than .950 would have meant they won significantly more games).

Surprisingly, the second spot in the batting order was the closest to being significant – but in the opposite way than expected, with the team losing more games than they won when Rickey hit second. The team performed the best when Rickey hit sixth.

So after almost 2000 games (more than 12 full seasons), it didn’t significantly matter where Rickey batted in the lineup. Each team’s win total was no different than what you might expect from flipping a coin 2000 times.

We did the same for Babe Ruth, using the 1921 version of Ruth that won our League of All-Time Greats. With Ruth, we found different results.

Ruth


Hitting Ruth leadoff resulted in a significantly greater number of wins than expected by chance, due to the number of additional plate appearances by the leadoff hitter (4.66 PA/game as a leadoff hitter compared to 4.46 in the #2 spot, decreasing steadily down to 3.81 in the #9 hole).

Hitting Ruth second approached but did not meet the criteria for significance, while hitting Ruth 9th approached but did not reach significance for fewer wins than by chance. Surprisingly, hitting Ruth 5th did result in significantly fewer wins than expected over the course of almost 2000 games. We have no explanation for this, as Tango’s analysis says the number of plate appearances and the expected baserunner/out situations has the #5 spot as the fourth most important (after #1, 2, and 4).

Ruth’s RBI stats would have likely suffered by hitting him leadoff – in 12+ seasons he had 7% fewer RBIs than the Babe Ruth who hit 3rd and 18% fewer RBIs than the one who hit 4th – but the extra plate appearances would have likely led to marginally more home runs (4% more in our sim), and his relatively high on-base percentage would have had him on more for later hitters to bring in (the leadoff Ruth had 15% more runs).

Most  importantly hitting him in the leadoff spot might have meant even more wins for the Yankees.


You can follow us on Twitter @BullpenByComm

How Charlie Ferguson and a Toad Could Have Altered Phillies’ History

Charlie Ferguson was a young promising pitcher for the Philadelphia Quakers in the 1880’s who more than held his own with the bat. SABR biographer Paul Hoffman claims that Charlie Ferguson was one of the “first tragic figures in major-league baseball” and could have “become one of the greatest players of all time”. Ferguson passed away at the age of 25 before the 1888 season from typhoid fever. His career stats were impressive.

On some days when he wasn’t pitching, he played in the field. In what would be his final season, he played 27 games at 2B, 5 at 3B, and 6 in the OF. In 300 plate appearances, he hit .337 with 85 RBIs, 13 SB, and an .886 OPS. He was well on his way to being an everyday player.

In his SABR bio, Hoffman notes that in 1925 – a whole 37 years after his death – a sports editor for the Philadelphia Evening Public Ledger called Ferguson “the greatest ballplayer who ever lived.” Hoffman concludes the bio by saying “One can only imagine how many games Ferguson might have won or what kind of everyday player he would have developed into had he lived to play an additional 12 to 15 years.”

Ferguson picCharlie Ferguson (from Baseball-Reference.com)

We decided to imagine by replaying history as if Charlie had never succumbed to typhoid fever.

We went back to 1888 using OOTP 2016 (and restructured the league to have accurate teams and rosters for that year). Charlie Ferguson then took his rightful place at the top of the rotation as well as their starting second baseman on days he did not pitch (all team settings were set to AI control except for the lineups and rotation for Philadelphia to accommodate for Ferguson playing every day. The game AI was in charge of everything else including all trades and signings).

The 1888 season for the Philadelphia Quakers as a whole did not start off too well. After a quick start they had fallen back to .500 by mid-May. Then the injury bug hit, and four regulars went down for the bulk of the rest of the year. While the Quakers rallied in the second half, they had dug themselves too deep a hole behind the Detroit Wolverines. Ferguson finished the season 30-23 with a 2.50 ERA and a 0.99 WHIP, leading the National League in WAR (10.1), innings pitched (479.2), most K/9 (4.50), and fewest BB/9 (1.05). He was tied for second in shutouts with 3. At the plate he hit a respectable .275 in 374 AB with 6 HR and 44 RBI, finishing with a 3.7 batting WAR, which was third on the Quakers.

His 1889 season ended early as he succumbed to injury on June 20th. While his pitching that year was not up to par (10-10, 3.61 ERA, 1.36 WHIP) his bat was more than making up for it. He had been leading the National League in OPS (.971) and was second in BA, OBP, and SLG when he went down.

In 1890, the now 27-year old was hitting his prime. The Quakers had now officially changed their name to the Phillies, and Ferguson continued to anchor their pitching staff. The Phillies were a game behind the Pittsburgh Alleghenys approaching the last series of the season. As luck would have it, they faced the Alleghenys in that series. Ferguson was given the ball for the first game of the three-game set. Unfortunately, Ferguson did not have his best stuff and he wasn’t helped by 5 Phillies errors. The Pirates won 7-2. They finished 91-63, one game behind Pittsburgh. That last start notwithstanding, Ferguson had bounced back from his injury to further his reputation, going 27-19 and leading the league in ERA (2.28) and WHIP (1.10). He finished 3rd in WAR (9.9). Playing right field when he wasn’t pitching, he again finished third on the team in batting WAR (3.9), hitting .283 with 73 RBI. If baseball back then had a most valuable player award and an award to honor the best pitcher, Ferguson would have won both of them.

1891 once again started slowly for both the Phillies, who quickly sank to 7th place and stayed there for most of the year. Management wouldn’t have it, and made the deal that would be celebrated for a generation. The Phillies traded four players: Billy Clingman, Fred Siefke, Bill Merritt, and Floyd Ritter to the Louisville Colonels for Toad Ramsey.

Toad, apart from having a memorable first name, is widely credited with inventing the knuckleball thanks to a tendon injury he had suffered in his index finger. In 1886 and 1887 he had two dominant seasons including one where he struck out 499 batters. In real life his career took a very quick downturn and he was out of the league after the 1890 season. However, in this world he was still the single most dominant pitcher in the American Association, winning 165 games over five years.

Ramsey picToad Ramsey (from Baseball-Reference.com)

The deal struck new life into the Phillies who went on a second half tear. In September they brought it to a new level, winning an incredible 16 straight games to end the season, with Ferguson winning his last 7 starts. But it was too little too late as they finished 2 games behind the Chicago Colts. But with two superstars leading the team, the time was ripe for the Phillies to finally make a push for a championship.

1892 turned out to be Ferguson’s best year yet. He tossed his first no-hitter on August 19th against the Pittsburgh Pirates, giving up only 1 walk. Ferguson and Toad Ramsey provided a dominant one-two punch that propelled the Phillies to their first ever National League pennant.* While Ferguson certainly shined, going 28-20 with a 2.24 ERA, 1.05 WHIP and 11.7 WAR, he was outdone by Toad who won the pitching triple crown, going 33-16 with a 1.59 ERA and 332 Ks.

With Toad and Ferguson, the Phillies cruised to the NL pennant again in 1893, finishing 13 games ahead of the Pirates. Ramsey won the pitching triple crown for the second straight year going an amazing 31-8 with a 1.97 ERA and 201 Ks. Ferguson again played second fiddle going 25-10 with a 3.25 ERA.

Toad would continue his amazing run, winning the pitching triple crown for an incredible third straight year in 1894, and fourth in 1895. But not all was stellar with Ferguson. In 1893 he had his worst season on the mound since his injury-shortened 1889 campaign, with the fewest wins, innings pitched, Ks, and WAR since that season. As their center fielder on days when he wasn’t pitching, Ferguson also had his worst year at the plate since his rookie campaign of 1884, hitting only .248 with 47 RBI and a 1.4 WAR in 508 plate appearances. Was the grind of playing every day getting to him?

Prior to the 1895 season in which Ferguson’s pitching stats declined farther, the decision was made to remove him from playing the field on his non-pitching days. Instead, Kid Gleason – who would often have the back end spot in the Phillies rotation – became a full time 3B, allowing Ferguson to focus solely on pitching. That move paid off as Ferguson had a bounce-back year at the age of 32, going 28-11 with a 2.75 ERA and a 9.2 WAR. The added rest also helped his hitting, as he topped .300 for the first time since 1889. More importantly Ferguson and Ramsey once again led the Phillies to a runaway NL pennant, as they won the league by 21 games over Cincinnati.

On May 9, 1896 Charlie Ferguson and the Phillies beat the Pittsburgh Pirates 17-1 for Ferguson’s 300th win, going the distance and giving up only 5 hits and no walks. Although the Phillies fell short of the pennant that season, Ferguson and Ramsey would win it again in 1897 for the Phillies’ fourth title.

Things went downhill for the Phillies as the century came to a close. They were leading the National League in late June of 1898 but then went on a 7-30 run to drop to last place despite excellent pitching from Ferguson and Ramsey. Ramsey would once again win the pitching triple crown (for an incredible 5th time in his career) and also notched his 400th win during that campaign.

Ferguson would get his 400th win in July of 1900 in a 3-2 win over the Chicago Orphans. The Phillies were back on top as they had signed Deacon Phillippe who now gave the Phillies three formidable starters. They won the National League pennant by 11 games over the Brooklyn Superbas.

That would be Ferguson’s and Ramsey’s last pennant. Toad would go on to win his 450th game in June of 1901, and Ferguson his in July of 1903 at the age of 40. On August 15th 1903, 39-year old Toad Ramsey beat the Chicago Cubs 9-4 for his 500th career win, but those two milestones weren’t enough as the Phillies finished third in the NL. In 1904 Ferguson would be removed from the rotation and relegated to mop up duties while Ramsey remained strong, winning his unprecedented 550th game September 27, 1905. and his 600th on July 31, 1908.

Ferguson would retire at the end of the 1905 season with a career record of 456-312, a 2.85 ERA and a 146.2 career WAR. His 456 wins would have put him second behind Cy Young, and his 146.2 career WAR would have been third behind Cy Young and Walter Johnson.

Ferguson Pitching

Toad would stick around for four more seasons, and would win his 600th game on July 31, 1908. He retired at the end of the 1909 season with a mind-boggling 603 wins, 5587 strikeouts, and a career 257.2 WAR. His wins and career WAR would top today’s all-time leaderboard, as would his 8636 career innings pitched. He would have been second all-time in strikeouts behind Nolan Ryan.

Ramsey Pitching

Meanwhile, without Charlie Ferguson and Toad Ramsey the real life Phillies would have to wait until 1915 for their first pennant and 1980 for their first World Series win.

* The World Series in its present form did not start until 1903. There was a championship series between the American Association and the National League up until the American Association folded after the 1891 season. While in some years there was either a split season championship series or a 1st vs 2nd place series at the end of the year, those permutations were not included in this sim, so there was no championship series from 1892 until 1903.

Follow us on Twitter @BullpenByComm

How Many Wins Does a Great Fielder Give a Team?

Recently we examined the impact at a team level of fielding, finding that, with everything else being equal, fielding can have a huge impact on a team’s win total. This is true even at fielding levels comparable to what we see in MLB.

It only follows to take it a step further and do the same thing at a positional level. Of course a slick-fielding shortstop should be more valuable than other positions (again, all else being equal).

So we followed a similar methodology as we did in our team-level analysis, except that we used only two teams: a control team and an experimental team. Again using OOTP 16, we built both teams by making clones of one player and one pitcher with average ratings – including average fielding ratings. We then modified one positional player on the experimental team and optimized their relevant fielding ratings, and only gave them experience in the position of interest to keep the AI manager from using them in different positions. Player development and injuries were turned off.

We then simmed five 162-game seasons to see what benefit having the optimized fielder had on the team’s chances of winning, and tracked the fielding stats for each.
Below is the impact on a team’s win total based on those five seasons. Granted there is some noise in the data (we could sim it 1000 times per position to reduce the noise, but hey, we’re not getting paid for this). Also, it turns out the single position player we cloned was a lefty, and all pitchers were righties, so there is a strong bias towards position players on the right side of the diamond. Again, we could correct for this if someone wanted to pay us.

Fielding results

The glaring finding is the importance of a superior defending center fielder. The ability to get to balls in the gap to take away extra base hits turns out to provide more than twice as many extra wins per 162 games as any other position.

The other finding is that with the exception of catchers, all superior fielders had MORE errors per season than their average fielding counterparts. The logic being the got to more balls in play and therefore had more opportunities for errors.

Again this is only looking at the benefit of a great fielder compared to an average one. It would be different to look at a situation like Yasmany Tomas and the D’backs decision to put his less-than-stellar defense in at third, and the impact of a terrible fielder on team wins.

Exploring the Impact of Fielding on Wins

We’ve previously used Out of the Park Baseball (OOTP) to test out theories on hitting, such as how well OPS and Runs Created predict team win totals. The sabermetrics folk have made great strides in trying to create meaningful statistics for fielding, including Ultimate Zone Rating (UZR), Total Zone (TZ), and Defensive Runs Saved (DRS). We won’t go into great detail about what each of those do – FanGraphs does a better job than we ever could. But it’s not as easy to take the results of any of these statistics and translate it to what matters most – a player’s contributions to a team’s win total.

Baseball Reference does include DRS into its WAR calculations, but there’s always a danger when we’re extrapolating one step beyond any one particular calculation. For instance, DRS provides an estimate of runs saved which is then used in a calculation to estimate how many additional wins you might expect. But each of those calculations will have an error range and will be impacted by a myriad of other factors. We were looking to use OOTP for a more direct way to see how fielding impacts a team’s win total.

Our first foray simply looked at teams with different overall fielding capabilities. OOTP uses several different ratings for fielding, available when editing player characteristics. For instance for an infielder there is Infield Range, Infield Error, Infield Arm, and Turn Double Plays. Each rating is based on a scale of 1-250.

OOTP Fielding

We set up an 11-team league, with each player on each team having the same overall fielding ability but with each team varying in their abilities. So for instance one team had each player with a “1” rating for each fielding ability, while another team had each player with a “250” for each fielding ability. All players had the same league average ratings for hitting. All pitchers were equivalent pitchers with average ratings, and an average ground/fly ratio.

We simmed three seasons (with all injuries and player development turned off). Of course, the better fielding teams did better, but it was somewhat surprising as to how much better they did. The team made up of the highest rated fielders average a record of 113-49 with the team made of the lowest rated fielders went and average of 42-120.

What was also interesting were the number of errors committed per game. The best fielding team committed only .28 errors per game with the worst fielding team 1.31. We would have thought with everyone on the team having a 1 rating for every fielding attribute that they would have kicked and thrown the ball around more. But they still on average gave one extra out to the other team than the best fielding team. By comparison in 2014 the Reds had the fewest errors (.62 errors/game) while the Indians had the most (.72 errors/game).
The more important difference seemed to be in balls the fielders didn’t get to due to range issues. Defensive efficiency for the best fielding team was .768 while for the worst it was .606. In 2014 the best team DEF was .712 by the Reds and the worst was .672 by the Twins.

So let’s try to extrapolate this to some meaningful MLB differences. Since the original league took fielding ratings to extremes, we created a league with teams whose defensive ratings more closely resembled MLB. In this 9-team league, fielding ratings for all players ranged between 115 and 155 (the range in the original sim which more closely resembled MLB fielding stats).

Again we simmed three seasons, and the difference between the first and last place teams was again quite large. The top fielding team went on average 92-70 while the worst fielding team went 71-91 – a whole 21 game difference. Here are the results:

Final stats

Along with charts for errors/game compared to wins and team DEF compared to wins.

Def and wins

Errors per game

There are certainly many factors that can influence these results – most notably around balls hit in play (e.g. increased strikeout rate, HR %). But this certainly does suggest that getting a good grasp on accurately rating fielders can have a big impact on a team’s win total.

The League of All-Time Greats: Part 2

In our last post, the League of All-Time Greats got underway, pitting the best all-time single seasons for batters up against one another in a 162-game season. April had finished with 2001 Barry Bonds slumping and 1921 Babe Ruth playing to form.

Ruth began to pull away in the Old Timers division in May, pulling off a 10-game winning streak including a three-game sweep of 2001 Sammy Sosa in which he outscored him 24-5. Bonds meanwhile clawed his way to the top of the New Timers division though his record didn’t top .500 until he beat Chuck Klein 3-1 on May 29th. Sosa, 1998 Mark McGwire, and 1932 Jimmie Foxx are bringing up the bottom of the whole league, with McGwire finishing May losing 8 of his last 9 and Foxx his last 6.

Barry really turned it around in June, going 20-10 while Babe kept pace going 19-8. By July 1st, it looked like the two of them would run away with it, with Barry up 10.5 games on Mark McGwire and Ruth 15.5 over Chuck Klein.

Most concerning for Bonds was his performance against Ruth. Barry was a meager 4-10 against him, getting outscored 89-52. This did not bode well for Barry’s chances at taking home the league title.
As the dog days of
summer rolled around though, Babe Ruth started to falter. Maybe his off-the-field antics magnified by having so many clones of himself in the locker room made him lose focus. Ruth played only .500 ball in August, though by then he had built up such a cushion over Chuck Klein that he still entered September up 14.5 games. Bonds, on the other hand, went 19-9 in August and built himself a 22-game lead over Sammy Sosa. But Bonds still could not solve Ruth, losing 4 of 7 against him in July and August.

Ruth got serious again in September pulling off a 12-game win streak to put any talk of distraction behind him. Both he and Barry pulled away as expected and finished the season more than 20 games ahead of the second place team in their respective divisions.
Season

In all, the Old Timers performed better than the “New” Timers, with Rogers Hornsby the only team in the Old Timer division to finish below .500 at 80-82. Mark McGwire meanwhile lost 102 games in the “New” Timers division.

Chuck Klein more than held his own going 84-78 and also won the batting title hitting .329 far ahead of Rogers Hornsby at .312. As a team though, Barry Bonds finished at .288 compared to Chuck Klein’s .286. Babe Ruth won the home run crown with a modest 30. Bonds topped the leaderboard for OBP (.400), wOBA (.387) and WAR (6.3).
Batting leaders

Next up: 1921 Babe Ruth vs. 2001 Barry Bonds in a nine-game World Series.

The League of All-Time Greats

Who had the greatest season of all time? Is it one of Babe Ruth’s many dominating seasons? Is it the 2001 version of Barry Bonds when he hit 73HR? Different stats tell slightly different stories. WAR has a different all-time leaderboard than Runs Created, which is also different from WPA (Win Probability Added). While that is a totally separate issue, we wanted to see how well the all-time greatest seasons stacked up head to head with each other, so the League of All-Time Greats came into being, once again using OOTP 15.

This league is made up of only 8 teams, split into 2 divisions. Going by Runs Created, which seems to be pretty robust metric in OOTP, we took the top 8 RC for a single season with the caveat that each player can only appear once – or else we would have more than half the league being made up of different versions of Babe Ruth and Barry Bonds. Each team’s lineup is made solely of that player without changing any of their season attributes, meaning that most players will be playing out of position.

The teams (Runs Created in parentheses):
– 2001 Barry Bonds (230)
– 1921 Babe Ruth (229)
– 1927 Lou Gehrig (208)
– 1932 Jimmie Foxx (202)
– 1922 Rogers Hornsby (202)
– 1930 Chuck Klein (193)
– 1998 Mark McGwire (193)
– 2001 Sammy Sosa (193)

The teams were divided into two divisions: The “Old-Timers” league was anyone from 1930 and before, while the “New-Timers” league consisted of the rest. The winners of each division meet in a best-of-nine World Series.

As we needed to set a year for this league to occur, we chose a year in between the two gaps (pre-1932 and post-1998) that had obvious baseball significance: 1961.

We also needed to fill out their teams with pitchers. We decided upon one pitcher for all, and again wanted to find someone meaningful. We didn’t want a superstar pitcher but landed someone above average with historical significance. We chose Orvall Overall, who played for the Cubs and lays claim to being the first pitcher to strike out 4 batters in one inning of a postseason game (not duplicated until Anibal Sanchez in 2013). More importantly he was the last man to be on the mound for the last out in a World Series clinching game for the Cubs.

The teams were all set up ready for Opening Day. The experts had their preseason predictions, and it looked like it was unsurprisingly going to be a Babe/Barry free for all.
Preseason Predictions

And the schedule makers wanted to start the season off with a bang.
Opening Day

In the Opening Day matchup, Bonds hit the only home run, but 3 separate Babe Ruth’s stole bases. Two Ruth doubles in the bottom of the 8th were the difference as Babe Ruth took the game 7-6.
Opening Day Game

That Opening Day loss stung Barry, and Bonds went on to lost the next two games to Ruth before finally getting a victory in the fourth and final game of the series. After winning two more in a row against Jimmie Foxx, Bonds went into a funk (maybe steroids weren’t as readily available in 1961?) and would lose 7 in a row, including getting swept by Rogers Hornsby. Bonds would show some signs of life at the end of April, beating Mark McGwire 8-0 and 17-7 in two consecutive games.

Babe Ruth meanwhile won 10 of his first 11 games, sweeping Chuck Klein and Sammy Sosa. He finished April 14-5 with a 1.5 game lead of Rogers Hornsby.

Jimmie Foxx got off to the slowest start, losing 12 of his first 13 being swept by Chuck Klein, Lou Gehrig, and Rogers Hornsby before finishing the month on a high note sweeping Sammy Sosa.
April

Will Barry turn it around? Thankfully for him Sosa and Foxx also stumbled out of the gate. More to come…

Recreating Billy Wagner

In honor of Billy Wagner following us on Twitter (@BullpenByComm), and since he was always a favorite fantasy closer (with the exception of the 2000 season), we thought we’d see what might have transpired with his career if things had happened just a little differently.

We started an OOTP historical league in 1995 – the year Billy made his debut with the Houston Astros.

In our alternate universe, Billy started at AA Jackson but quickly made the jump to Tucson in the PCL. Even though he struggled with control, giving up 7 walks in 12 innings, the Astros pulled the trigger and called him up on June 1st, 1995 as lefty reliever Pedro A. Martinez was ineffective. Wagner made his major league debut on June 3rd against the Atlanta Braves – and suffered the loss giving up a run in the 7th on a fielder’s choice after David Justice led off with a double and went to third on a sac bunt. But he was in the big leagues to stay.

His first save came on July 18th, filling in for a tired Todd Jones who had pitched in 4 of the past 5 games. He got the last two outs against the Dodgers on 4 pitches. However, his rookie season came to an abrupt end on August 20th when he left a win against the Reds with discomfort. He was diagnosed with a partially torn labrum, though doctors assured him he’d be ready for spring training. He finished his rookie season going 0-1 with 1 save and a 4.62 ERA over 25 1/3 IP.

His path to being a closer was delayed as the Astros bolstered their bullpen after the ’95 season by signing free agent closer John Wetteland, likely due to uncertainty around Wagner’s late season injury. Wagner would spend the next two seasons being the primary setup man, leading the team in games pitched and holds both years.

Billy’s breakout year came in 1998. In a bold move, manager Terry Collins announced in spring training that he was switching the roles of Wetteland and Wagner. Collins was on the hot seat as the Astros had a disappointing finish to the ’97 season. While Wetteland wasn’t thrilled with the news, he reluctantly accepted his role and proved to be a reliable setup man. Billy made sure his manager’s gamble paid off and went on to lead the NL in saves with 48. His final line of 10-3 with 48 saves, a 2.12 ERA and 93 K’s in 72.1 IP helped him finish third in Cy Young voting. He led the Astros to the top of the Central Division, though they lost in the NLCS to the Padres.

Wagner saved 40 games for the Astros in each of his next two seasons, though issues with control were popping up, walking 46 in 76IP in 1999 and 40 in 63.1IP in 2000. The Astros finished second both years, and Terry Collins was let go for his inability to take the Astros to the next level.

2001 was a year of uncertainty for Wagner. Collins, the man who given Billy his break, was gone. Instead, the Astros hired a rookie manager in Bob Taylor. Wagner was also entering his contract year.

It turned out to be a year of disappointment. The Astros, after finishing first or second since Wagner was on the team, fell to 73-89. Wagner finished with 30 saves and a rather high 4.33 ERA, though his control was returning. He and the Astros failed to come to terms on a long-term deal and Wagner agreed to give it one more year, signing an extension for well below market value. It was a gamble on Wagner’s part fueled by the very strong free agent crop, headlined by Mariano Rivera.

2002 turned out to be his last year with the Astros. He finished 7-2 with 26 saves and a 2.70 ERA and hit the free agent market. On December 11, 2002 he came to terms on a 1-year $2.72 million deal with the Baltimore Orioles to serve as their closer. His gamble hadn’t paid off, as the free agent crop for closers was once again exceptionally strong (in part because Rivera only signed a one year deal and again was the top closer available). He left Houston 2nd all-time in saves but holding the top three spots on the single season saves leaderboard.

He pitched well for the O’s in 2003 saving 36 games with a 3.02 ERA and helped them get to the ALCS, but management didn’t want him back at the price he wanted. Wagner moved on from there, signing his biggest contract to date: a 3-year deal with the Mariners for $11.52 million.

In his three years in Seattle, he saved 31, 36, and 39 games, respectively. On May 22nd, 2006 Wagner entered a game in the 9th against his old team, the Orioles. Up 4-3, he got two quick outs before 2 singles put runners at the corners. He got Toby Hall to meekly ground out to record his 300th career save. After the 2006 season, Wagner decided to hit the free agent market for a chance at one last long-term contract, and left Seattle as their all-time saves leader (106).

The now 35-year old stayed in the AL West, signing with Oakland for 3 years and $8.08 million, even though Oakland had lost over 100 games the past three seasons. Wagner helped stabilize Oakland’s bullpen by racking up 28 saves and the A’s improved by 16 games in 2006 finishing 77-85. Meanwhile Wagner’s old team – the Mariners – made it to the World Series.

In 2007 Wagner fell out of favor with manager Jim Fregosi. The A’s signed Brad Lidge during spring training as bullpen insurance, and Fregosi went straight to him as his closer. The A’s were making a mid-season push for a wildcard spot and went out and traded for Francisco Cordero who took over for Lidge. Suddenly, Wagner found himself third on the closer depth chart and finished with only 3 saves, though he led the team with 22 holds.

Buck Showalter took over the A’s in 2009 and moved Wagner up as the primary setup man to newly acquired closer Mike Gonzalez. Showalter guided the A’s to a World Series championship that year. Unfortunately Wagner was unable to take part in his first chance at World Series glory, as the labrum he partially tore back in 1995 tore again on August 29th. He finished 2009 5-3 with 4 saves and a 3.11 ERA.

Given his shoulder and his age (now 38) Oakland decided not to resign Wagner. The Dodgers were interested, and signed him for 2 years at $8.44 million – the only time Wagner would earn more than $4 million in a season. The Dodgers, coming off a 110-win season, already had Mariano Rivera as their closer, so Wagner once again settled in to be their setup man. Unfortunately the wheels fell off the Dodgers’ bus as their starting staff was ravaged by injuries. The Dodgers became so desperate that they turned to some of their middle relievers to help out. On August 7th, Billy Wagner made the first of 8 career starts in a no-decision against the Nationals going 4.1 innings giving up one run on 6 hits, striking out 4 and walking one. He earned a win in his next start on August 13th against the Braves, going 6 strong giving up one run on only 3 hits. On the 18th against the Rockies he pitched 5.2 shutout innings getting his second (and final) win as a starting pitcher.

Disappointed with the season in which the Dodgers finished last at 70-92 as well as his role on the team, Billy Wagner announced his retirement from baseball on October 31, 2010. He retired fifth all-time in saves with 366 to go along with a 68-63 record in 1041 games. He was an All-Star four times (1998, 1999, 2000, & 2004).
His career pitching stats (click to enlarge):
Wagner

Comparing fake Billy Wagner to the real Billy Wagner, fake Billy had fewer saves (422 to 366) and fewer All-Star seasons (7 to 4) but more wins (68 to 47) and more games (1041 to 853) – and of course more games started (8 to 0). Both Billy’s never appeared in a World Series game, though the fake Billy was on the DL when his A’s won in 2009. One other important aspect in which the real Billy fared better was in lifetime earnings, as fake Billy’s agent was never able to parlay his 1998 breakout season into a big payday.

How well do wOBA and RC Predict Team Performance?

Okay, so we’ve already done two posts looking at OOTP leagues filled with clones of two players: Slappy Slapstick and Sluggish Slugger. One showed that Sluggish, the low BA guy with sexy power, got walloped head to head by Slappy, the unsexy high BA no power guy. The second showed the same in an MLB environment, but only when Slappy and Sluggish both had OPS high above the league average. Sluggish was better in the MLB environment when both had league average OPS.

These sims showed the limitations of OPS – the first big sabermetric stat to make its way into national telecasts – certainly lacks somewhat in being a robust stat to value all players. Being an arbitrary stat simply combining OBP with SLG it’s not surprising that it lacks robustness. So we went looking for something that might work better.

So we turned to wOBA (weighted On-Base Average). This stat, created by Tom Tango, is based on the common sense premise that all hits are not created equal. The stat uses aggregate league totals to weight the value of each method of getting on base (a good description of wOBA and how it is calculated can be found at FanGraphs).

Unfortunately, OOTP does not deal with wOBA, so transferring this to the Slappy/Sluggish universe took a little bit of work. First, we ran one season with Slappy and Sluggish and calculated the weights for wOBA using league totals, and modified the abilities of Slappy and Sluggish to make them equivalent in wOBA and equal to the wOBA from the previous season. This, by the way, gave a rather sizable advantage in OPS to the Sluggers (.887 to .799). Their attributes stats predicted a line for the Slappy’s of .347/.452/.799 with no HR. The Sluggers were designed to go .253/.303/.887 with 42 HR.

Then we set them loose on 5 seasons – after each season we restored the league back so as not to mess with the weights for wOBA which change from year to year.

In this universe, the results were much closer. Teams made up of Slappy’s won an average of 85 games a year with teams made up of Sluggish Slugger’s won an average of 77. While this still might seem an advantage for the Slappy’s, you have to keep in mind we took two very extreme players – the Slappy’s were give the lowest possible rating (1) for gap and power attributes. Teams made up of Slappy’s never hit more than 2 home runs in any single season (and while I didn’t bother to comb through the individual box scores I would not be surprised if they were all inside-the-park jobs). Also, to create a league made solely of these players (along with clones of the same average pitcher), would greatly amplify any differences between the two groups. In a MLB environment where there is a variation in terms of players’ skills, these differences would likely be noticeable at all.

Then we did the same with RC (Runs Created), created by Bill James. This is in thanks to a suggestion made by a member of the Baseball Sim Addicts!!! Facebook group. As with wOBA this took a little bit of tweaking but both Slappy and Sluggish were made to have an equivalent RC of 99. Slappy’s stat line was created to be .371/.491/.862 with Sluggish’s working out to .220/.332/.868. After running 5 additional seasons we came out with nearly the exact same overall results: Slappy’s teams finished with an average of 84 wins with the Sluggers finishing with an average of 78.

wOBA and RC certainly did a lot better at evening out the two teams. One could argue that a difference of 7 or 8 games in a simulation designed to greatly exaggerate any differences goes a long way in demonstrating the robustness of the two metrics. And even with these small but consistent differences they are the best metrics available when applied to a typical ML team. It does lead me to wonder though what is behind the small (and in the real world likely meaningless) advantage the Slappy’s have. Do the formulas need some minor tweaking? Is there something in the OOTP game engine?

Update: After a night of thinking about it, it likely has to do with fielding. All players were set to equivalent fielding ratings – but they were all average. Since the Slappy’s had a greater number of balls put in play, it allowed for more opportunities for errors. Looking back at the yearly stats the Sluggers did consistently produce more errors, some of which would have led to runs. While I cannot say for certain at this time, it would look like that could very well be the deciding factor between the two teams.

Slappy’s vs. Sluggers Part 2

My “real” job for the past 20 years has been a researcher. It’s a well-known saying that good research raises more questions than it answers. My previous blog post on singles hitters versus sluggers raised a few questions and comments. One comment came from through Twitter from Geoff M.:

Another well-known fact of research is that a single study will always have inherent limitations (or flaws, if you like). Using just a league of Slappy’s and Sluggers has the shortcoming of potentially amplifying any differences between the two. Just because it shows up in a league made completely out of those types of players doesn’t mean it would have any kind of noticeable impact in a league more representative of MLB.

So I went ahead with Geoff’s suggestion.

The original Slappy vs. Slugger sim gave each player an arbitrary OPS of .800. For my initial sim, I gave each player the league average after a 2014 MLB sim, which came out to .732. Turning off injuries, player development, and not allowing the AI to make any roster changes, I simmed 10 singular seasons with 1 team of Slappy’s, 1 team of Slugger’s, and 28 MLB teams. Both the Slappy and Slugger teams had Average Pitchers who were created with expected stats to be the league average.

The first set of 10 seasons was a bit eye-opening:

Picture2

In only 2 seasons did the Slapsticks win more games than the Sluggers, and as you can see, both teams made up of league average players were just utterly awful, losing on average more than 100 games a season.

This brought up the question of whether the OPS value used affected the outcome. So I did two additional sims: one replicated the original 4-team Slappy/Slugger league with everyone having a .732 OPS and the other replicated the Slappy/Slugger in MLB with each Slappy and Slugger having an .800 OPS.

First, the original 4-team league. Turns out changing the OPS to .732 made no difference, with season after season having the two teams of Slappy’s well ahead of the Sluggers (I also ran several more seasons of the original experiment just to be sure). The Slappy’s consistently won 90+ games with the Sluggers winning 60+. So the second level of OPS made no difference in that sim.

The MLB sim with both Slappy’s and Sluggers having .800 OPS was different. Here is the average performance of each team over ten seasons comparing both sets of sims:

Picture3

In this, the Slappy’s greatly improved their win total and beat out the Sluggers in every category (though OPS was very close). The Slappy’s even had two winning seasons. I wish I had a compelling answer for why the Sluggers outplayed the Slapsticks when each had a low OPS in an MLB environment but the Slapsticks won out in an MLB environment with a higher OPS while the sims with just the 4-team league always showed a consistent Slappy advantage.

At least with the four different sims we ran, the Slappy’s outperformed the Sluggers in three of them, though in a real-life environment it may depend on the value of OPS and not be a very straightforward answer.

If you have any hypotheses feel free to comment below or send us a tweet at @BullpenByComm.