Tag Archives: Sabermetrics

Exploring the Impact of Fielding on Wins

We’ve previously used Out of the Park Baseball (OOTP) to test out theories on hitting, such as how well OPS and Runs Created predict team win totals. The sabermetrics folk have made great strides in trying to create meaningful statistics for fielding, including Ultimate Zone Rating (UZR), Total Zone (TZ), and Defensive Runs Saved (DRS). We won’t go into great detail about what each of those do – FanGraphs does a better job than we ever could. But it’s not as easy to take the results of any of these statistics and translate it to what matters most – a player’s contributions to a team’s win total.

Baseball Reference does include DRS into its WAR calculations, but there’s always a danger when we’re extrapolating one step beyond any one particular calculation. For instance, DRS provides an estimate of runs saved which is then used in a calculation to estimate how many additional wins you might expect. But each of those calculations will have an error range and will be impacted by a myriad of other factors. We were looking to use OOTP for a more direct way to see how fielding impacts a team’s win total.

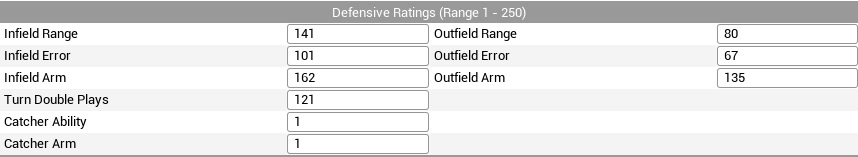
Our first foray simply looked at teams with different overall fielding capabilities. OOTP uses several different ratings for fielding, available when editing player characteristics. For instance for an infielder there is Infield Range, Infield Error, Infield Arm, and Turn Double Plays. Each rating is based on a scale of 1-250.

OOTP Fielding

We set up an 11-team league, with each player on each team having the same overall fielding ability but with each team varying in their abilities. So for instance one team had each player with a “1” rating for each fielding ability, while another team had each player with a “250” for each fielding ability. All players had the same league average ratings for hitting. All pitchers were equivalent pitchers with average ratings, and an average ground/fly ratio.

We simmed three seasons (with all injuries and player development turned off). Of course, the better fielding teams did better, but it was somewhat surprising as to how much better they did. The team made up of the highest rated fielders average a record of 113-49 with the team made of the lowest rated fielders went and average of 42-120.

What was also interesting were the number of errors committed per game. The best fielding team committed only .28 errors per game with the worst fielding team 1.31. We would have thought with everyone on the team having a 1 rating for every fielding attribute that they would have kicked and thrown the ball around more. But they still on average gave one extra out to the other team than the best fielding team. By comparison in 2014 the Reds had the fewest errors (.62 errors/game) while the Indians had the most (.72 errors/game).
The more important difference seemed to be in balls the fielders didn’t get to due to range issues. Defensive efficiency for the best fielding team was .768 while for the worst it was .606. In 2014 the best team DEF was .712 by the Reds and the worst was .672 by the Twins.

So let’s try to extrapolate this to some meaningful MLB differences. Since the original league took fielding ratings to extremes, we created a league with teams whose defensive ratings more closely resembled MLB. In this 9-team league, fielding ratings for all players ranged between 115 and 155 (the range in the original sim which more closely resembled MLB fielding stats).

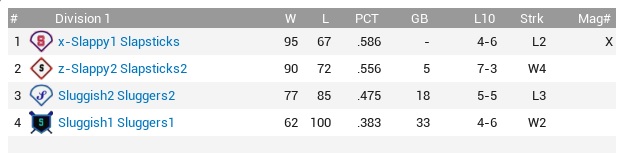
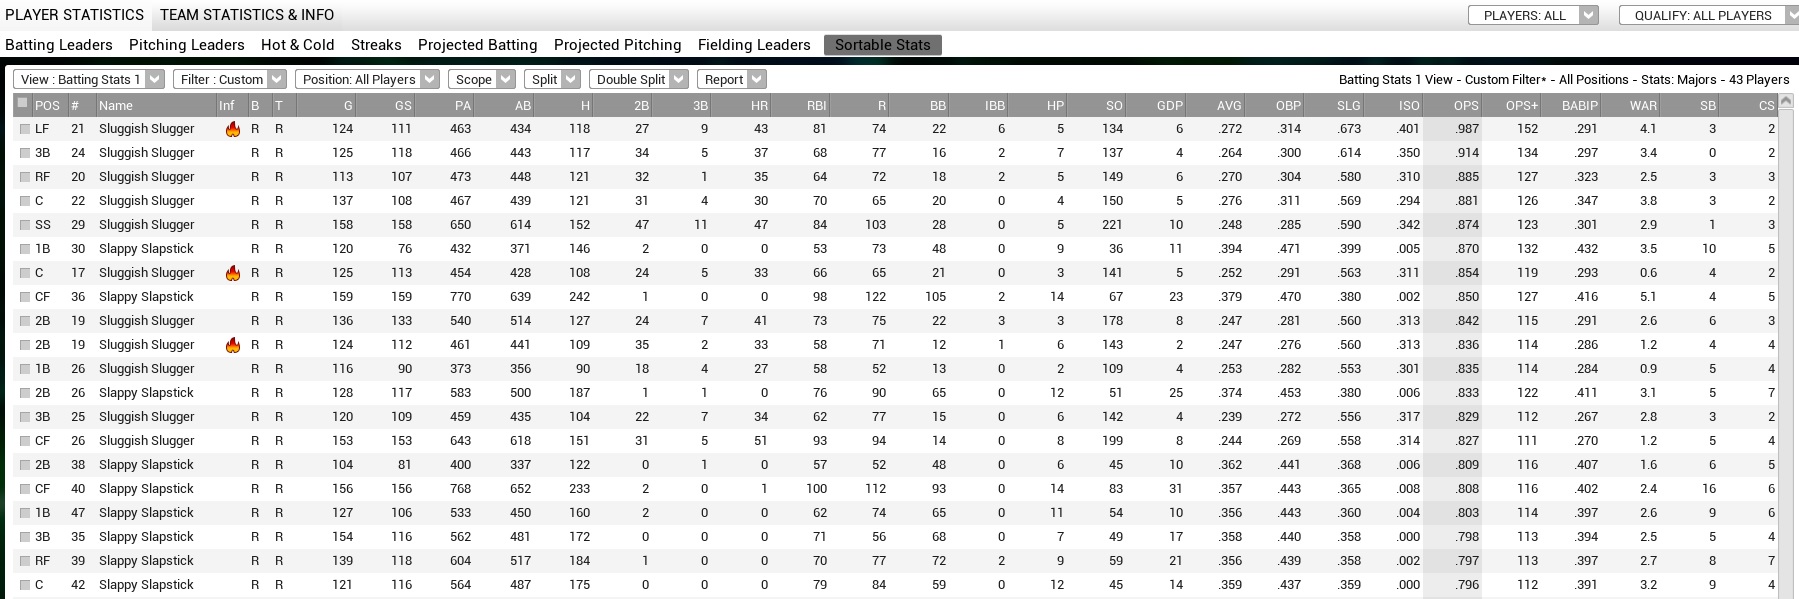
Again we simmed three seasons, and the difference between the first and last place teams was again quite large. The top fielding team went on average 92-70 while the worst fielding team went 71-91 – a whole 21 game difference. Here are the results:

Final stats

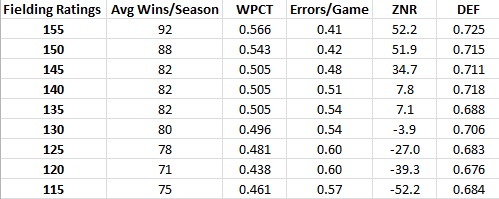
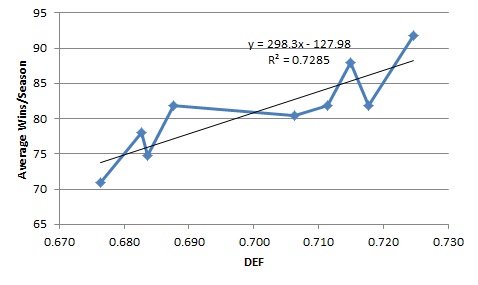
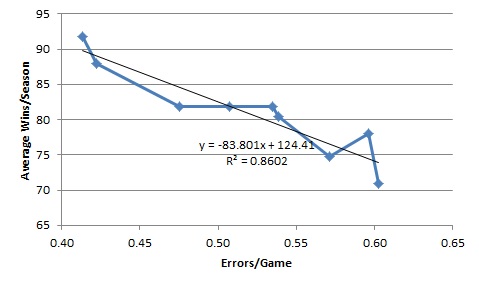
Along with charts for errors/game compared to wins and team DEF compared to wins.

Def and wins

Errors per game

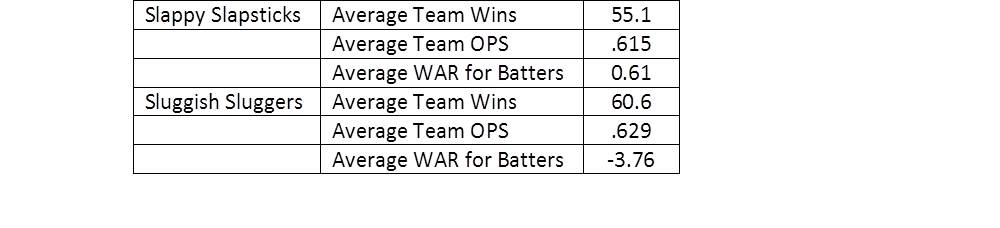
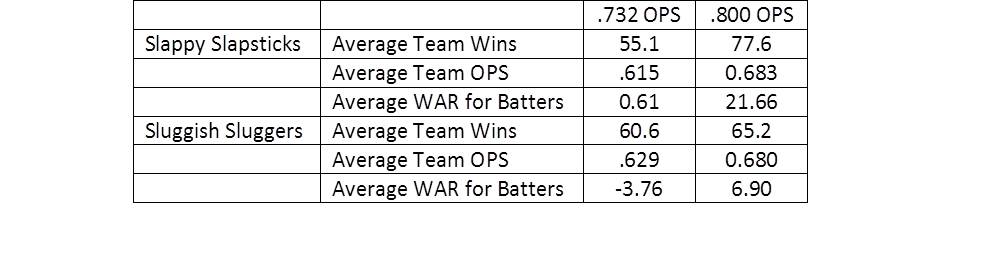
There are certainly many factors that can influence these results – most notably around balls hit in play (e.g. increased strikeout rate, HR %). But this certainly does suggest that getting a good grasp on accurately rating fielders can have a big impact on a team’s win total.

2015 NL Team Free Agent WAR Analysis

Pitchers and catchers have reported.  People need reasons to look toward spring especially if you live in the Eastern half of the country.  So, let’s evaluate some ballplayers!

In this post, I will be evaluating the offseason free agent acquisitions for the National League.  I will be using WAR (Wins Above Replacement) to evaluate the fifteen NL teams and its players.  (WAR stats are courtesy of www.fangraphs.com – if you click on the player’s name, it should direct you to their website.)

Braves

Name Position 2014 Team Age 2014 WAR 2015 WAR CS Years CS Salary New Team Date Years Salary
Nick Markakis RF Orioles 31 2.5 0.9 3 $33.00 Braves 12/3/2014 4 $44.00
Jason Grilli RP Angels 38 0.3 0.6 Braves 12/23/2014 2 $8.30
Josh Outman RP Yankees 30 0 0 Braves 1/7/2015 1 $0.90
Jim Johnson RP Tigers 31 0 0.2 Braves 12/3/2014 1 $1.60
Jonny Gomes LF Athletics 34 -0.3 -0.3 Braves 1/22/2015 1 $4.00
A.J. Pierzynski C Cardinals 38 -0.4 0.7 Braves 12/27/2014 1 $2.00
Alberto Callaspo 2B/DH Athletics 31 -1.1 0.6 Braves 12/9/2014 1 $3.00

Nick Markakis seems to generate the same WAR every year.  His projected WAR this year is a quite a bit lower (a 64% decrease) probably because he’s coming over to the NL where there’s better pitching and his home park is historically a pitcher’s park.  He’s past peak age and he has Freddie Freeman’s company as the only other true power threat in the Braves lineup.  Should be an interesting year for Mr. Markakis.

Jonny Gomes has a cool name.  That’s about all I can say about him.

AJ Pierzynski is now 38 years old.  When the heck did that happen?  He goes from the Cardinals to the Braves.  Fangraphs predicts him to be above replacement level with a projection of 0.7.  Pierzynski’s best days seem to be behind him, but you could do worse at the catcher’s spot.

Brewers

Name Position 2014 Team Age 2014 WAR 2015 WAR CS Years CS Salary QO New Team Date Years Salary
Neal Cotts RP Rangers 34 0.8 0.5 Brewers 1/30/2015 1 $3.00

Neal Cotts is still playing?!?  His K/9 last year was 8.51.  Not bad, but not dominant for a reliever.  He’s a lefty so he’ll probably play for about 8 more years.

Cardinals

Name Position 2014 Team Age 2014 WAR 2015 WAR CS Years CS Salary New Team Date Years Salary
Mark Reynolds 1B/3B Brewers 31 1.6 0.3 1 $4.00 Cardinals 12/11/2014 1 $2.00
Carlos Villanueva RP Cubs 31 1.1 0.3 Cardinals 2/4/2015 1 $0.20
Matt Belisle RP Rockies 34 0.5 0 Cardinals 12/2/2014 1 $3.50

The Cardinals have picked up the MLB single season strikeout leader in Mark Reynolds.  But, he did hit 22 HR last year.  His fellow power lineup mates are Matt Holliday and Jhonny Peralta.  He may have a decent year power-wise.

I keep waiting for Carlos Villanueva to do something exciting like: throw a no-hitter, be an ace starter, or a become a closer.  His career averages:  K/9 – 7.77, BB/9 – 3.0, HR/9 – 1.21.  Ah, that’s the problem… gives up too many long balls.  STL’s home park will not help with that.

Belisle is your average joe middle reliever.  His career HR/9 is below 1.0.  Not bad!

Cubs

Name Position 2014 Team Age 2014 WAR 2015 WAR CS Years CS Salary New Team Date Years Salary
Jon Lester SP Athletics 31 6.1 3.8 6 $132.00 Cubs 12/9/2014 6 $155.00
Jason Hammel SP Athletics 32 1.7 2.3 3 $27.00 Cubs 12/8/2014 2 $20.00
Chris Denorfia RF/LF Mariners 34 0.4 0.9 Cubs 1/6/2015 1 $2.60
David Ross C Red Sox 37 0.2 0.9 Cubs 12/23/2014 2 $5.00
Jason Motte RP Cardinals 32 0 0 Cubs 12/15/2014 1 $4.50

Jon Lester is an above average pitcher, but wow, that’s a lot of moolah.  Well, good for him.  He’s a left-hander.  He’s in his prime.  And he’s pitching half his games at Wrigley Field.  He should have a solid year.   But maybe not as good as last year according to projected WAR.

Hammel had a great year last year.  His WAR was 1.7 .  FanGraphs predicts 2.3.  I predict a worse year.  He’s prone to the long ball and his career HR/9 is over 1.0

Looks like the Cubs picked up a couple of veterans to fill out the roster in Denorfia and Ross.

Jason Motte did not pitch in 2013.  He pitched some last year, but he’s still trying to shake the rust off.  We’ll see if he can help out the Cubs in ’15.

Diamondbacks

Name Position 2014 Team Age 2014 WAR 2015 WAR CS Years CS Salary New Team Date Years Salary
Gerald Laird C Braves 35 -0.1 0.7 Diamondbacks 2/2/2015 1 $0.20

Gerald Laird is your prototypical backup catcher.  Good D, no bat.

Dodgers

Name Position 2014 Team Age 2014 WAR 2015 WAR CS Years CS Salary New Team Date Years Salary
Brandon McCarthy SP Yankees 31 3 2.6 3 $36.00 Dodgers 12/16/2014 4 $48.00
Brett Anderson SP Rockies 27 1.1 2.1 1 $7.00 Dodgers 12/31/2014 1 $10.00
Erik Bedard RP Rays 35 0.2 -0.6 Dodgers 1/18/2015 1 $0.20
Sergio Santos RP Blue Jays 31 0 0.4 Dodgers 12/30/2014 1 $0.20
Dustin McGowan RP Blue Jays 32 0 -0.1 Dodgers 2/23/2015 1 $0.50
Brandon Beachy SP 28 0.7 Dodgers 2/21/2015 1 $2.80

Slight dip in Projected WAR for Brandon McCarthy.  His best WAR year was 4.5 with Oakland.  He is the magical prime age of 31 which is half of the success formula for pitchers coming to the NL.  Too bad he’s not a lefty.

Brett Anderson, another former A, is a lefty, but he’s only 27.  His WAR totals are rather erratic : 2009 – 3.6; 2010 – 2.4; 2011- 1.0 2012 – 0.9; 2013 – 0.3; 2014- 1.1 .  Maybe he’ll get things going in the right direction for Dodger Blue.  Moving from Colorado to LA should help.

Remember when Sergio Santos was a shortstop prospect? No?  I do.

Dustin McGowan reminds me of Carlos Villanueva.  Scouts rave about his arm and talent.  Well, when’s he going to something with it?  Last great year was 2007 – WAR – 3.5.  Move to the NL might bump him up some, but it’s gotta be close to his last chance.

Giants

Name Position 2014 Team Age 2014 WAR 2015 WAR CS Years CS Salary New Team Date Years Salary
Nori Aoki RF Royals 33 2.3 1.6 2 $14.00 Giants 1/16/2015 1 $4.00
Jake Peavy SP Giants 33 1.9 1.2 2 $24.00 Giants 12/19/2014 2 $24.00
Ryan Vogelsong SP Giants 37 1 0.6 1 $7.00 Giants 1/23/2015 1 $4.00
Sergio Romo RP Giants 31 0 0.3 2 $12.00 Giants 12/22/2014 2 $15.00

Nori Aoki is the poor man’s Ichiro Suzuki.   Guy knows how to rake.  He can steal a bit- probably needs to be given the green light more.  WAR is projected to go down, but not much.  His WARs are 2012 – 2.3; 2013- 1.6; 2014 – 2.3; Projected 2015 – 1.6.  Consistent.

Jake Peavy should be a 100 years old by now.  Just kidding.  Just seems like he’s been around forever.  His K/9s are slowly trending downward, but not a bad option for a #3 starter.

Sergio Romo is the Giants closer.  He saved 38 games in 2013 and dipped down to 23 last year.  His HR/9 last year was 1.40.  He will have to correct that if he wants to remain closer.

Marlins

Name Position 2014 Team Age 2014 WAR 2015 WAR CS Years CS Salary New Team Date Years Salary
Michael Morse 1B/LF Giants 32 1 0.8 1 $7.00 Marlins 12/17/2014 2 $16.00
Ichiro Suzuki RF Yankees 41 0.4 -0.7 1 $5.00 Marlins 1/23/2015 1 $2.00
Reid Brignac 3B Phillies 29 -0.3 -1.1 Marlins 11/19/2014 1 $0.20

I always think that Michael Morse is overrated.  He hit 31 HR in 2011, so he has power.  He’s an OK power hitter and his 2015 Projected WAR agrees:  0.8

ICHIRO!  The MLB single season hit leader will be taking his farewell tour to Miami.  ICHIRO struck out 3 times as often as he walked last year, which seems very un-ICHIRO-like.  He stole 15 bases last year probably mostly on brains and guile alone.  But, he is 41.

Reid Brignac.  Likely trying to win a bench spot with the Marlins this year.

Mets

Name Position 2014 Team Age 2014 WAR 2015 WAR CS Years CS Salary New Team Date Years Salary
Michael Cuddyer 1B/RF Rockies 35 1.5 0.7 2 $18.00 Mets 11/10/2014 2 $21.00
John Mayberry 1B/LF Blue Jays 31 0.2 -0.2 Mets 12/15/2015 1 $1.50

Michael Cuddyer signed with the Mets.  Did the Mets move those fences in yet?  Cuddyer is a nice hitter at his age, but his home park will not help him.

Nationals

Name Position 2014 Team Age 2014 WAR 2015 WAR CS Years CS Salary New Team Date Years Salary
Max Scherzer SP Tigers 30 5.6 4.1 7 $168.00 Nationals 1/21/2014 7 $210.00
Casey Janssen RP Blue Jays 33 0.1 0.2 Nationals 2/2/2015 1 $5.00
Heath Bell RP Rays 37 0 -0.2 Nationals 12/27/2014 1 $1.00
Dan Uggla 2B Giants 34 -0.8 -0.3 Nationals 12/26/2014 1 $0.20

The Nats made a big splash in the offseason signing Max Scherzer to a 7 year, $210 million contract adding him to an already loaded pitching staff.  This guy is a dynamite pitcher already and now he’s coming to the NL.  Projected WAR says 4.1, but I say sky’s the limit, folks.

Casey Janssen’s Projected WAR for 2015 went up by 50 percent from his actual WAR in 2014.  It’s that NL effect, I tell ya.  Will compete for the closing job in Washington.

Dan Uggla has an eye condition, according to RotoWire News, which may put his 2015 in jeopardy.

Heath Bell is trying to turn his career around.  His K/9 as recently as 2013 was 9.87.

Padres

Name Position 2014 Team Age 2014 WAR 2015 WAR CS Years CS Salary New Team Date Years Salary
James Shields SP Royals 33 3.7 2.7 5 $90.00 Padres 2/12/2015 4 $75.00
Brandon Morrow RP Blue Jays 30 0.4 -0.2 1 $6.00 Padres 12/16/2014 1 $2.50
Clint Barmes 2B/SS Pirates 35 0.3 0 Padres 12/3/2014 1 $1.50
Josh Johnson SP 31 2.1 1 $5.00 Padres 1/7/2015 1 $1.00

James Shields has pitched 200+ innings 8 seasons in a row.  He’s a good pitcher.  How much more can the arm take?  Stay tuned.

Brandon Morrow’s BB/9 for his career is 4.16.  Pass.

Clint Barmes seems to be coming towards the end of his career.  He’s a decent fielder so he’ll be probably be brought in for defensive purposes.

Josh Johnson has had 2 Tommy John surgeries.  The odds of coming back from this are long.  Hopefully, luck is on his side.

Phillies

Name Position 2014 Team Age 2014 WAR 2015 WAR CS Years CS Salary New Team Date Years Salary
Aaron Harang SP Braves 36 2.5 0 1 $6.00 Phillies 1/5/2015 1 $5.00
Chad Billingsley SP 30 1.1 1 $5.00 Phillies 1/29/2015 1 $1.50

 Aaron Harang is a serviceable starting pitcher.  He’s going to Philadelphia which could make things tough considering their recent history.  His projected WAR this year is 0.0.  On the plus side, Philly’s home park is a pitcher’s park, which could bail him out of HR trouble.

Billingsley’s had surgeries in two straight years: TJ and torn flexor repair.  His career total WAR is 17.2.  Best season was 2008 9.01 K/9; 4.1 WAR.

Pirates

Name Position 2014 Team Age 2014 WAR 2015 WAR CS Years CS Salary New Team Date Years Salary
Francisco Liriano SP Pirates 31 1.6 2.9 3 $36.00 Pirates 12/12/2014 3 $39.00
A.J. Burnett SP Phillies 38 1 1.9 1 $10.00 Pirates 11/14/2014 1 $8.50
Corey Hart DH Mariners 32 -1.2 0.7 Pirates 12/19/2014 1 $2.50

Fangraphs is predicting quite the bump up in WAR for Francisco Liriano 1.6 to 2.9.  He’s a lefty and he’s 31.  Could be a big year!

Burnett is back with the Pirates after a lost year with the Phillies.  PNC is surprisingly more of  a hitter’s park than Citizen’s Bank so Burnett’s HR total might increase.  Keep an eye on it.

Hart is quite injury prone lately with knee and hamstring problems.  He will be platooning with Pedro Alavarez at first base.  But, he’s got some punch in that bat.  Might be a sneaky good pickup for the Bucs.

Reds

Name Position 2014 Team Age 2014 WAR 2015 WAR CS Years CS Salary New Team Date Years Salary
Burke Badenhop RP Red Sox 32 1 0.2 Reds 2/7/2015 1 $2.50
Kevin Gregg RP Marlins 36 0 -0.1 Reds 2/7/2015 1 $0.20
Paul Maholm RP Dodgers 32 0 0 Reds 2/3/2015 1 $0.20

Kevin Gregg.  Hmm.  He threw a cutter 21.5% of the time last year.  Might help him in his new home digs in Cincy.Burke Badenhop before been better?  A bad attempt at an alliterative sentence.  What I mean to say is… has Badenhop ever been good?  Last year was his best WAR year at 1.0.  Half his home games in Fenway Park!  Wow.

Paul Maholm.  He’s a lefty.  He’s 32.  About the best I can say about him is his GB% last year was 54.4%.

Rockies

Name Position 2014 Team Age 2014 WAR 2015 WAR CS Years CS Salary New Team Date Years Salary
Nick Hundley C Orioles 31 0.3 1.5 Rockies 12/31/2014 2 $6.30
Daniel Descalso 2B/SS Cardinals 28 0 0.1 Rockies 12/16/2014 2 $3.60
John Axford RP Pirates 31 0 0.5 Rockies 2/2/2015 1 $0.20
Rafael Betancourt RP 39 0 Rockies 1/30/2015 1 $0.20

Nick Hundley has some pop in his bat.  He’s coming to Coors Field.  Could be a match in baseball heaven!

Descalso comes to the Rockies from St. Louis baseball heaven.  He has zero pop in his bat.  Will get on base occasionally, but won’t thrill you.  Best WAR year 2010 – 0.4.

Axford had a couple of high save total years with the Brewers in 2010 (46) and 2011 (35).  He had two WAR years of 1.8.  Seems to have fallen off a cliff somewhat.  Could bounce back in Colorado, but he’s gotta keep the ball in the park.

Betancourt has had some crazy command years.  89 Ks to 8 BBs in 2010 for the Rockies for a K/BB ratio of 11.25.  He’s fallen off in recent years.  He signed a minor league deal and hopes to hang for a last year of glory in the Mile High City.

Next Up:  The American League!

How well do wOBA and RC Predict Team Performance?

Okay, so we’ve already done two posts looking at OOTP leagues filled with clones of two players: Slappy Slapstick and Sluggish Slugger. One showed that Sluggish, the low BA guy with sexy power, got walloped head to head by Slappy, the unsexy high BA no power guy. The second showed the same in an MLB environment, but only when Slappy and Sluggish both had OPS high above the league average. Sluggish was better in the MLB environment when both had league average OPS.

These sims showed the limitations of OPS – the first big sabermetric stat to make its way into national telecasts – certainly lacks somewhat in being a robust stat to value all players. Being an arbitrary stat simply combining OBP with SLG it’s not surprising that it lacks robustness. So we went looking for something that might work better.

So we turned to wOBA (weighted On-Base Average). This stat, created by Tom Tango, is based on the common sense premise that all hits are not created equal. The stat uses aggregate league totals to weight the value of each method of getting on base (a good description of wOBA and how it is calculated can be found at FanGraphs).

Unfortunately, OOTP does not deal with wOBA, so transferring this to the Slappy/Sluggish universe took a little bit of work. First, we ran one season with Slappy and Sluggish and calculated the weights for wOBA using league totals, and modified the abilities of Slappy and Sluggish to make them equivalent in wOBA and equal to the wOBA from the previous season. This, by the way, gave a rather sizable advantage in OPS to the Sluggers (.887 to .799). Their attributes stats predicted a line for the Slappy’s of .347/.452/.799 with no HR. The Sluggers were designed to go .253/.303/.887 with 42 HR.

Then we set them loose on 5 seasons – after each season we restored the league back so as not to mess with the weights for wOBA which change from year to year.

In this universe, the results were much closer. Teams made up of Slappy’s won an average of 85 games a year with teams made up of Sluggish Slugger’s won an average of 77. While this still might seem an advantage for the Slappy’s, you have to keep in mind we took two very extreme players – the Slappy’s were give the lowest possible rating (1) for gap and power attributes. Teams made up of Slappy’s never hit more than 2 home runs in any single season (and while I didn’t bother to comb through the individual box scores I would not be surprised if they were all inside-the-park jobs). Also, to create a league made solely of these players (along with clones of the same average pitcher), would greatly amplify any differences between the two groups. In a MLB environment where there is a variation in terms of players’ skills, these differences would likely be noticeable at all.

Then we did the same with RC (Runs Created), created by Bill James. This is in thanks to a suggestion made by a member of the Baseball Sim Addicts!!! Facebook group. As with wOBA this took a little bit of tweaking but both Slappy and Sluggish were made to have an equivalent RC of 99. Slappy’s stat line was created to be .371/.491/.862 with Sluggish’s working out to .220/.332/.868. After running 5 additional seasons we came out with nearly the exact same overall results: Slappy’s teams finished with an average of 84 wins with the Sluggers finishing with an average of 78.

wOBA and RC certainly did a lot better at evening out the two teams. One could argue that a difference of 7 or 8 games in a simulation designed to greatly exaggerate any differences goes a long way in demonstrating the robustness of the two metrics. And even with these small but consistent differences they are the best metrics available when applied to a typical ML team. It does lead me to wonder though what is behind the small (and in the real world likely meaningless) advantage the Slappy’s have. Do the formulas need some minor tweaking? Is there something in the OOTP game engine?

Update: After a night of thinking about it, it likely has to do with fielding. All players were set to equivalent fielding ratings – but they were all average. Since the Slappy’s had a greater number of balls put in play, it allowed for more opportunities for errors. Looking back at the yearly stats the Sluggers did consistently produce more errors, some of which would have led to runs. While I cannot say for certain at this time, it would look like that could very well be the deciding factor between the two teams.

Slappy’s vs. Sluggers Part 2

My “real” job for the past 20 years has been a researcher. It’s a well-known saying that good research raises more questions than it answers. My previous blog post on singles hitters versus sluggers raised a few questions and comments. One comment came from through Twitter from Geoff M.:

Another well-known fact of research is that a single study will always have inherent limitations (or flaws, if you like). Using just a league of Slappy’s and Sluggers has the shortcoming of potentially amplifying any differences between the two. Just because it shows up in a league made completely out of those types of players doesn’t mean it would have any kind of noticeable impact in a league more representative of MLB.

So I went ahead with Geoff’s suggestion.

The original Slappy vs. Slugger sim gave each player an arbitrary OPS of .800. For my initial sim, I gave each player the league average after a 2014 MLB sim, which came out to .732. Turning off injuries, player development, and not allowing the AI to make any roster changes, I simmed 10 singular seasons with 1 team of Slappy’s, 1 team of Slugger’s, and 28 MLB teams. Both the Slappy and Slugger teams had Average Pitchers who were created with expected stats to be the league average.

The first set of 10 seasons was a bit eye-opening:

Picture2

In only 2 seasons did the Slapsticks win more games than the Sluggers, and as you can see, both teams made up of league average players were just utterly awful, losing on average more than 100 games a season.

This brought up the question of whether the OPS value used affected the outcome. So I did two additional sims: one replicated the original 4-team Slappy/Slugger league with everyone having a .732 OPS and the other replicated the Slappy/Slugger in MLB with each Slappy and Slugger having an .800 OPS.

First, the original 4-team league. Turns out changing the OPS to .732 made no difference, with season after season having the two teams of Slappy’s well ahead of the Sluggers (I also ran several more seasons of the original experiment just to be sure). The Slappy’s consistently won 90+ games with the Sluggers winning 60+. So the second level of OPS made no difference in that sim.

The MLB sim with both Slappy’s and Sluggers having .800 OPS was different. Here is the average performance of each team over ten seasons comparing both sets of sims:

Picture3

In this, the Slappy’s greatly improved their win total and beat out the Sluggers in every category (though OPS was very close). The Slappy’s even had two winning seasons. I wish I had a compelling answer for why the Sluggers outplayed the Slapsticks when each had a low OPS in an MLB environment but the Slapsticks won out in an MLB environment with a higher OPS while the sims with just the 4-team league always showed a consistent Slappy advantage.

At least with the four different sims we ran, the Slappy’s outperformed the Sluggers in three of them, though in a real-life environment it may depend on the value of OPS and not be a very straightforward answer.

If you have any hypotheses feel free to comment below or send us a tweet at @BullpenByComm.

Singles Hitters vs. Sluggers

One of the classic baseball debates is the relative worth of Punch and Judy hitters and power hackers. Which one provides greater value to their team?

Using Out of the Park Baseball, we decided to put this to the test. Using their player editor feature, I created the following three players:

Slappy Slapstick
Projected stats
BA: .347; OBP: .452; SLG: .347; OPS: .799

Sluggish Slugger
Projected stats
BA: .216; OBP: .253; SLG: .547 (42HR over 660PA); OPS: .800

Average Pitcher
Projected stats
OAVG: .248; ERA: 3.75

Slappy had high ratings for BABIP, Avoid K’s, and Eye/Patience with the lowest possible scores for Gap and Power. Sluggish had high Gap and Power scores with low scores for other ratings. All other ratings (e.g. basestealing, fielding) were equal. The overriding factor for the main ratings was to get projected OPS to be equal, which I did as best as possible.

I cloned each player to fill up 2 teams of Slappy Slapsticks and 2 teams of Sluggish Sluggers. Each team had an 11-man pitching staff made up of Average Pitchers.

Then I set them loose on a 162-game season. Here is a snapshot of the final standings, with the results plainly clear.
Standings

The two teams of Slappy Slapsticks far and away beat on the Sluggers. The final stats showed that OPS ended up actually somewhat in favor of the Sluggers. Sluggers made up the entire top 5 and 8 of the top 10 league leaders in OPS.
OPS
(Click chart to enlarge)

RC27 (Runs Created per 27 outs) was in favor of the Slapsticks, with 7 of the top 8 leaders in that category.
RC Leaders
(Click chart to enlarge)

WPA (Win Probability Added) was also in favor of the Slapsticks taking the top 6 spots in that category.
WPA Leaders
(Click chart to enlarge)

It’s not possible from this exact run to know what sabermetric stat put the Slapsticks over the top as some (such as BABIP) were designed to be greater for the Slapsticks than the Sluggers. This simulation shows that OPS being equal, a singles hitter is more valuable in the end than a slugger, but it also shows that OPS, being a somewhat arbitrarily derived statistic, is not the defining stat to determine the value of a hitter or how that hitter might translate to team performance.