Slappy’s vs. Sluggers Part 2

My “real” job for the past 20 years has been a researcher. It’s a well-known saying that good research raises more questions than it answers. My previous blog post on singles hitters versus sluggers raised a few questions and comments. One comment came from through Twitter from Geoff M.:

Another well-known fact of research is that a single study will always have inherent limitations (or flaws, if you like). Using just a league of Slappy’s and Sluggers has the shortcoming of potentially amplifying any differences between the two. Just because it shows up in a league made completely out of those types of players doesn’t mean it would have any kind of noticeable impact in a league more representative of MLB.

So I went ahead with Geoff’s suggestion.

The original Slappy vs. Slugger sim gave each player an arbitrary OPS of .800. For my initial sim, I gave each player the league average after a 2014 MLB sim, which came out to .732. Turning off injuries, player development, and not allowing the AI to make any roster changes, I simmed 10 singular seasons with 1 team of Slappy’s, 1 team of Slugger’s, and 28 MLB teams. Both the Slappy and Slugger teams had Average Pitchers who were created with expected stats to be the league average.

The first set of 10 seasons was a bit eye-opening:

Picture2

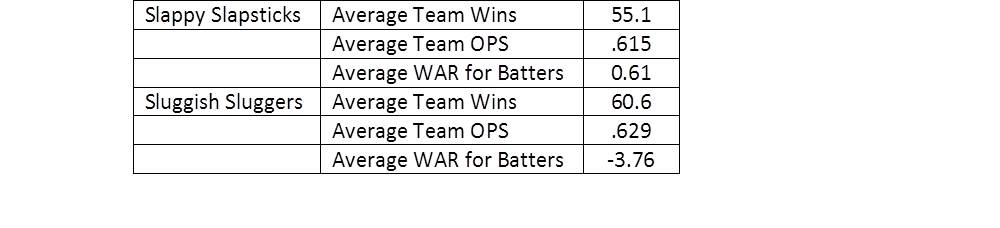
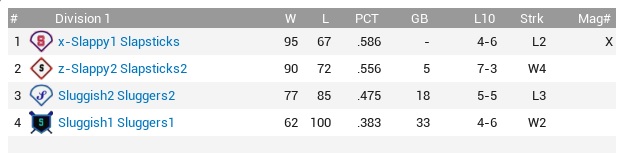
In only 2 seasons did the Slapsticks win more games than the Sluggers, and as you can see, both teams made up of league average players were just utterly awful, losing on average more than 100 games a season.

This brought up the question of whether the OPS value used affected the outcome. So I did two additional sims: one replicated the original 4-team Slappy/Slugger league with everyone having a .732 OPS and the other replicated the Slappy/Slugger in MLB with each Slappy and Slugger having an .800 OPS.

First, the original 4-team league. Turns out changing the OPS to .732 made no difference, with season after season having the two teams of Slappy’s well ahead of the Sluggers (I also ran several more seasons of the original experiment just to be sure). The Slappy’s consistently won 90+ games with the Sluggers winning 60+. So the second level of OPS made no difference in that sim.

The MLB sim with both Slappy’s and Sluggers having .800 OPS was different. Here is the average performance of each team over ten seasons comparing both sets of sims:

Picture3

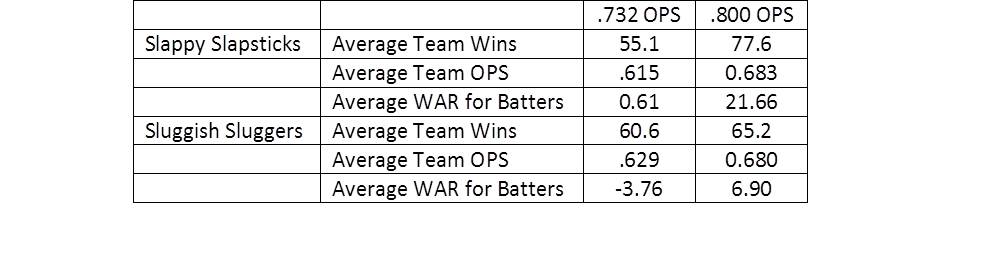
In this, the Slappy’s greatly improved their win total and beat out the Sluggers in every category (though OPS was very close). The Slappy’s even had two winning seasons. I wish I had a compelling answer for why the Sluggers outplayed the Slapsticks when each had a low OPS in an MLB environment but the Slapsticks won out in an MLB environment with a higher OPS while the sims with just the 4-team league always showed a consistent Slappy advantage.

At least with the four different sims we ran, the Slappy’s outperformed the Sluggers in three of them, though in a real-life environment it may depend on the value of OPS and not be a very straightforward answer.

If you have any hypotheses feel free to comment below or send us a tweet at @BullpenByComm.

Singles Hitters vs. Sluggers

One of the classic baseball debates is the relative worth of Punch and Judy hitters and power hackers. Which one provides greater value to their team?

Using Out of the Park Baseball, we decided to put this to the test. Using their player editor feature, I created the following three players:

Slappy Slapstick
Projected stats
BA: .347; OBP: .452; SLG: .347; OPS: .799

Sluggish Slugger
Projected stats
BA: .216; OBP: .253; SLG: .547 (42HR over 660PA); OPS: .800

Average Pitcher
Projected stats
OAVG: .248; ERA: 3.75

Slappy had high ratings for BABIP, Avoid K’s, and Eye/Patience with the lowest possible scores for Gap and Power. Sluggish had high Gap and Power scores with low scores for other ratings. All other ratings (e.g. basestealing, fielding) were equal. The overriding factor for the main ratings was to get projected OPS to be equal, which I did as best as possible.

I cloned each player to fill up 2 teams of Slappy Slapsticks and 2 teams of Sluggish Sluggers. Each team had an 11-man pitching staff made up of Average Pitchers.

Then I set them loose on a 162-game season. Here is a snapshot of the final standings, with the results plainly clear.
Standings

The two teams of Slappy Slapsticks far and away beat on the Sluggers. The final stats showed that OPS ended up actually somewhat in favor of the Sluggers. Sluggers made up the entire top 5 and 8 of the top 10 league leaders in OPS.
OPS
(Click chart to enlarge)

RC27 (Runs Created per 27 outs) was in favor of the Slapsticks, with 7 of the top 8 leaders in that category.
RC Leaders
(Click chart to enlarge)

WPA (Win Probability Added) was also in favor of the Slapsticks taking the top 6 spots in that category.
WPA Leaders
(Click chart to enlarge)

It’s not possible from this exact run to know what sabermetric stat put the Slapsticks over the top as some (such as BABIP) were designed to be greater for the Slapsticks than the Sluggers. This simulation shows that OPS being equal, a singles hitter is more valuable in the end than a slugger, but it also shows that OPS, being a somewhat arbitrarily derived statistic, is not the defining stat to determine the value of a hitter or how that hitter might translate to team performance.

An Alternative Baseball Universe

I’ve been hooked on Out of the Park Baseball since OOTP 3 (since OOTP16 will be coming out this year it’ll be about 13 years) and have found that its breadth and realism only improves with each version. I won’t go through all of its capabilities here, but it’s absolutely worth the purchase if you’re into baseball simulations.

One of my projects with OOTP was to rerun all of MLB history using OOTP. Baseball more than any other sport clings to its history so it was interesting to see what an equally plausible history might have been like.

I just started it in 1871 and let it sim by itself all the way to the end of 2014 only checking periodically to adjust who made the Hall of Fame. The only change I made was that players were drafted instead of playing for the teams they really played for.

This alternative history looks quite different.

One example is Cy Young. It turns out in our alternate universe Cy wrecked his shoulder in 1900 and ended up with a respectable but unmemorable 193 career wins. The Cy Young award became the Charlie J Ferguson award. Ferguson, who in real life only pitched 4 pretty good seasons before succumbing to typhoid fever prior to the 1888 season (99-64 career record going 30-9 in 1886) pitched in this alternate universe from 1884 to 1906 compiling a 475-375 record and a whopping 218 career WAR.

Babe Ruth was a good enough pitcher and bad enough fielder that he stayed with pitching, finishing with 233 career wins. He failed to make the Hall of Fame.

Hank Aaron (326 HR), Willie Mays (336 HR), Willie McCovey (253 HR) all fell short as they succumbed to injuries prematurely. Same with Bob Gibson (85 career W). None are a real part of that universe’s baseball lore.

However, Tony Conigliaro never got beaned in the face, and for a time was the HR king (passing Mickey Mantle), and after 2014 was still second all-time with 681 HR. Mark McGwire’s body didn’t break down and he’s the home run leader at 687. Sosa and Bonds had subpar careers due to injury. Mantle and Ted Williams each won the MVP award 10 times while Denny McClain never got into trouble with the mob and finished with 7 Charlie Ferguson awards, the most ever.

Sandy Koufax did a John Smoltz and for a while was the career saves leader with 351, but was surpassed by Masanori Murakami. In the real world, Murakami was the first Japanese player in the majors but played only 2 seasons for the Giants before he contractually had to return to Japan. Here he stayed in the majors and finished with 502 career saves. He was later surpassed by Rob Dibble (528) and Robb Nen (629).

The best single season in this alternative universe belonged to Lou Gehrig (1930) – .451BA, 45HR, 126RBI, 14.1WAR and that’s with missing 7 weeks due to *gasp* injury. Those seven weeks actually limited him to only 490 plate appearances, below the threshold to qualify for top season batting average.

Johnny Damon was lucky enough to play for Colorado and was the last player to hit .400, going .406 in 1999 with 37HR and 150RBI to boot (10.1 WAR).

The best hitter of all-time would be an argument between Rogers Hornsby and Ted Williams, depending upon whether you favored WAR or OPS as your defining statistic. Given changes in the game across the years, WAR would likely be the best metric to determine an all-time best hitter. Hornsby played from 1915 to 1940. He’s the all-time hit leader with 4378. He smacked 446 HR, had 2229 RBI and is 1st all-time in career VORP (1510) and WAR (150). Williams played from 1939 to 1958 hitting 569 HR with 1740 RBI, a .337 BA. He was first all-time in career OPS (1.071).

The all-time leaders in WAR are:

– Rogers Hornsby (150)
– Luis Gonzalez (142?!?!?)
– Ted Williams (134)
– Mickey Mantle (134)
– Albert Pujols (132 – still active)

The longest hitting streak was 46 games by the legendary Possum Whitted who in our alternate universe played from 1912-1924 with a career .284 average and 7.2 WAR. In real life he played mostly as a part-timer from 1912-1922, with a career .269 BA. Mo Vaughn had the 3rd longest hitting streak at 44 games.

Your all-time great franchise is the Athletics (PHI-KC-OAK) with 38 playoff appearances and 13 World Series titles (both tops). The Yanks haven’t won the World Series since 1941 while the 1950’s belonged to Detroit who appeared in 5 of 6 WS from 1950-55 and won 4 of them, then winning again in ’58. The AL won 14 of 15 WS from 1958-1972. The Brewers franchise (starting with the Seattle Pilots in ’69) is your model of futility appearing in the playoffs only once and having a .421 lifetime winning percentage.

While all this is interesting to think about it also brings up a question about OOTP and the accuracy of its simulations. All the major milestone records I’ve noted thus far are all below real-life records. Is this a limitation of all types of sims? Career records for HR, BA, RBI, W, S, are all higher in real-life than in this alternate universe, but both Hornsby and Ty Cobb had more hits than Pete Rose (4378 and 4377 respectively – Rose only finished with 2514). The record for career triples was blown away (Sam Crawford beat himself out on that one 384 to 309). Jim Handiboe demolished the real-world record for career losses. Jim had a 443-484 record in our alternate universe playing for bad Brooklyn teams from 1886-1911 compared to Cy Young’s 316 real-world losses. There were a few single season outliers such as Gehrig’s .451 season and Richie Sexson knocking in 190 runs in 2000 in this alternate universe, but it’s too small a sample size with too many other factors to jump to any conclusions.

We are undertaking additional projects using OOTP which we will post, as we try to answer various what-if scenarios and age-old baseball questions using sims. We’re happy to take suggestions that we could address using OOTP. Feel free to leave those in the comments section.