Tag Archives: OPS

How well do wOBA and RC Predict Team Performance?

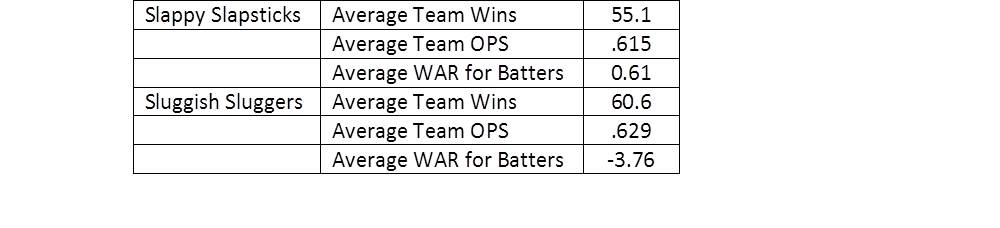
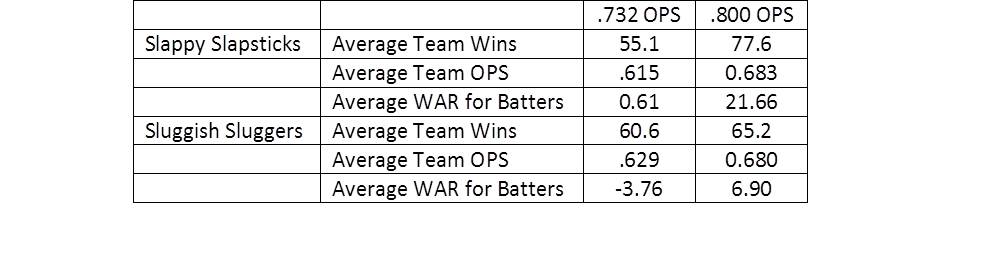
Okay, so we’ve already done two posts looking at OOTP leagues filled with clones of two players: Slappy Slapstick and Sluggish Slugger. One showed that Sluggish, the low BA guy with sexy power, got walloped head to head by Slappy, the unsexy high BA no power guy. The second showed the same in an MLB environment, but only when Slappy and Sluggish both had OPS high above the league average. Sluggish was better in the MLB environment when both had league average OPS.

These sims showed the limitations of OPS – the first big sabermetric stat to make its way into national telecasts – certainly lacks somewhat in being a robust stat to value all players. Being an arbitrary stat simply combining OBP with SLG it’s not surprising that it lacks robustness. So we went looking for something that might work better.

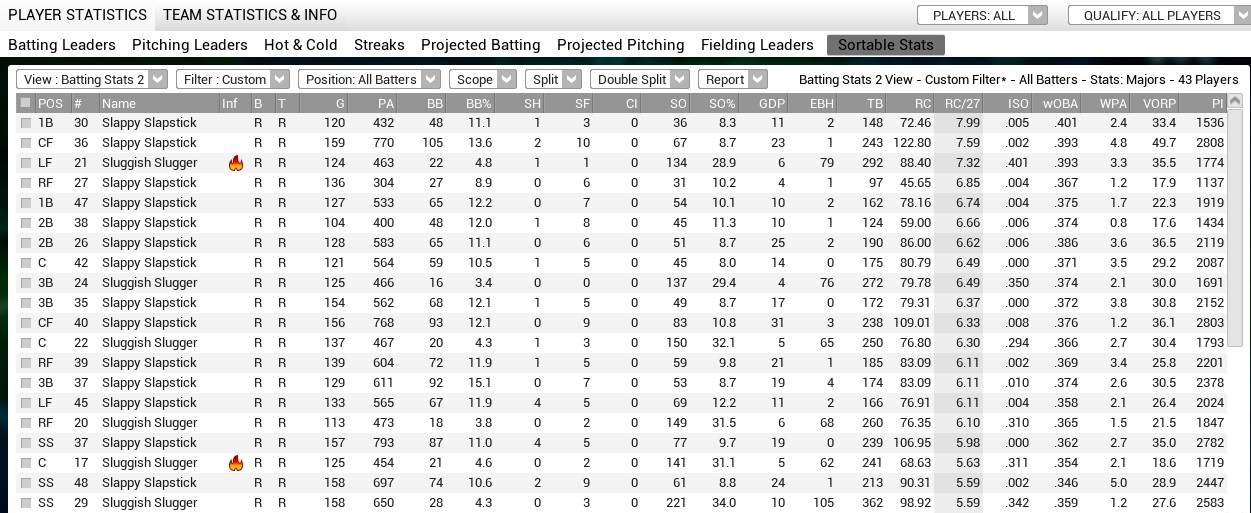
So we turned to wOBA (weighted On-Base Average). This stat, created by Tom Tango, is based on the common sense premise that all hits are not created equal. The stat uses aggregate league totals to weight the value of each method of getting on base (a good description of wOBA and how it is calculated can be found at FanGraphs).

Unfortunately, OOTP does not deal with wOBA, so transferring this to the Slappy/Sluggish universe took a little bit of work. First, we ran one season with Slappy and Sluggish and calculated the weights for wOBA using league totals, and modified the abilities of Slappy and Sluggish to make them equivalent in wOBA and equal to the wOBA from the previous season. This, by the way, gave a rather sizable advantage in OPS to the Sluggers (.887 to .799). Their attributes stats predicted a line for the Slappy’s of .347/.452/.799 with no HR. The Sluggers were designed to go .253/.303/.887 with 42 HR.

Then we set them loose on 5 seasons – after each season we restored the league back so as not to mess with the weights for wOBA which change from year to year.

In this universe, the results were much closer. Teams made up of Slappy’s won an average of 85 games a year with teams made up of Sluggish Slugger’s won an average of 77. While this still might seem an advantage for the Slappy’s, you have to keep in mind we took two very extreme players – the Slappy’s were give the lowest possible rating (1) for gap and power attributes. Teams made up of Slappy’s never hit more than 2 home runs in any single season (and while I didn’t bother to comb through the individual box scores I would not be surprised if they were all inside-the-park jobs). Also, to create a league made solely of these players (along with clones of the same average pitcher), would greatly amplify any differences between the two groups. In a MLB environment where there is a variation in terms of players’ skills, these differences would likely be noticeable at all.

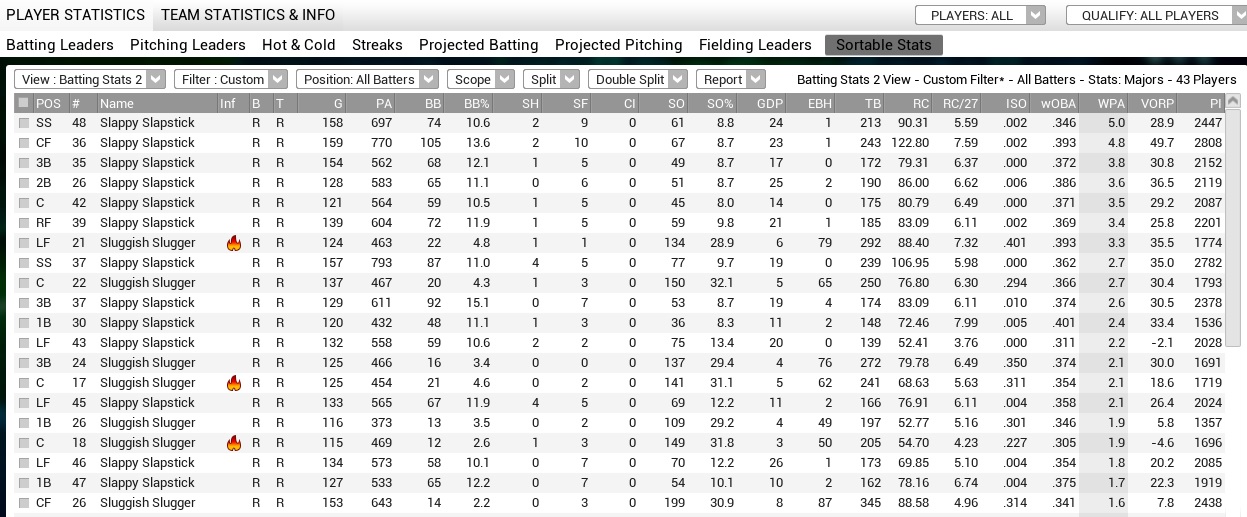
Then we did the same with RC (Runs Created), created by Bill James. This is in thanks to a suggestion made by a member of the Baseball Sim Addicts!!! Facebook group. As with wOBA this took a little bit of tweaking but both Slappy and Sluggish were made to have an equivalent RC of 99. Slappy’s stat line was created to be .371/.491/.862 with Sluggish’s working out to .220/.332/.868. After running 5 additional seasons we came out with nearly the exact same overall results: Slappy’s teams finished with an average of 84 wins with the Sluggers finishing with an average of 78.

wOBA and RC certainly did a lot better at evening out the two teams. One could argue that a difference of 7 or 8 games in a simulation designed to greatly exaggerate any differences goes a long way in demonstrating the robustness of the two metrics. And even with these small but consistent differences they are the best metrics available when applied to a typical ML team. It does lead me to wonder though what is behind the small (and in the real world likely meaningless) advantage the Slappy’s have. Do the formulas need some minor tweaking? Is there something in the OOTP game engine?

Update: After a night of thinking about it, it likely has to do with fielding. All players were set to equivalent fielding ratings – but they were all average. Since the Slappy’s had a greater number of balls put in play, it allowed for more opportunities for errors. Looking back at the yearly stats the Sluggers did consistently produce more errors, some of which would have led to runs. While I cannot say for certain at this time, it would look like that could very well be the deciding factor between the two teams.

Slappy’s vs. Sluggers Part 2

My “real” job for the past 20 years has been a researcher. It’s a well-known saying that good research raises more questions than it answers. My previous blog post on singles hitters versus sluggers raised a few questions and comments. One comment came from through Twitter from Geoff M.:

Another well-known fact of research is that a single study will always have inherent limitations (or flaws, if you like). Using just a league of Slappy’s and Sluggers has the shortcoming of potentially amplifying any differences between the two. Just because it shows up in a league made completely out of those types of players doesn’t mean it would have any kind of noticeable impact in a league more representative of MLB.

So I went ahead with Geoff’s suggestion.

The original Slappy vs. Slugger sim gave each player an arbitrary OPS of .800. For my initial sim, I gave each player the league average after a 2014 MLB sim, which came out to .732. Turning off injuries, player development, and not allowing the AI to make any roster changes, I simmed 10 singular seasons with 1 team of Slappy’s, 1 team of Slugger’s, and 28 MLB teams. Both the Slappy and Slugger teams had Average Pitchers who were created with expected stats to be the league average.

The first set of 10 seasons was a bit eye-opening:

Picture2

In only 2 seasons did the Slapsticks win more games than the Sluggers, and as you can see, both teams made up of league average players were just utterly awful, losing on average more than 100 games a season.

This brought up the question of whether the OPS value used affected the outcome. So I did two additional sims: one replicated the original 4-team Slappy/Slugger league with everyone having a .732 OPS and the other replicated the Slappy/Slugger in MLB with each Slappy and Slugger having an .800 OPS.

First, the original 4-team league. Turns out changing the OPS to .732 made no difference, with season after season having the two teams of Slappy’s well ahead of the Sluggers (I also ran several more seasons of the original experiment just to be sure). The Slappy’s consistently won 90+ games with the Sluggers winning 60+. So the second level of OPS made no difference in that sim.

The MLB sim with both Slappy’s and Sluggers having .800 OPS was different. Here is the average performance of each team over ten seasons comparing both sets of sims:

Picture3

In this, the Slappy’s greatly improved their win total and beat out the Sluggers in every category (though OPS was very close). The Slappy’s even had two winning seasons. I wish I had a compelling answer for why the Sluggers outplayed the Slapsticks when each had a low OPS in an MLB environment but the Slapsticks won out in an MLB environment with a higher OPS while the sims with just the 4-team league always showed a consistent Slappy advantage.

At least with the four different sims we ran, the Slappy’s outperformed the Sluggers in three of them, though in a real-life environment it may depend on the value of OPS and not be a very straightforward answer.

If you have any hypotheses feel free to comment below or send us a tweet at @BullpenByComm.

Singles Hitters vs. Sluggers

One of the classic baseball debates is the relative worth of Punch and Judy hitters and power hackers. Which one provides greater value to their team?

Using Out of the Park Baseball, we decided to put this to the test. Using their player editor feature, I created the following three players:

Slappy Slapstick
Projected stats
BA: .347; OBP: .452; SLG: .347; OPS: .799

Sluggish Slugger
Projected stats
BA: .216; OBP: .253; SLG: .547 (42HR over 660PA); OPS: .800

Average Pitcher
Projected stats
OAVG: .248; ERA: 3.75

Slappy had high ratings for BABIP, Avoid K’s, and Eye/Patience with the lowest possible scores for Gap and Power. Sluggish had high Gap and Power scores with low scores for other ratings. All other ratings (e.g. basestealing, fielding) were equal. The overriding factor for the main ratings was to get projected OPS to be equal, which I did as best as possible.

I cloned each player to fill up 2 teams of Slappy Slapsticks and 2 teams of Sluggish Sluggers. Each team had an 11-man pitching staff made up of Average Pitchers.

Then I set them loose on a 162-game season. Here is a snapshot of the final standings, with the results plainly clear.
Standings

The two teams of Slappy Slapsticks far and away beat on the Sluggers. The final stats showed that OPS ended up actually somewhat in favor of the Sluggers. Sluggers made up the entire top 5 and 8 of the top 10 league leaders in OPS.
OPS
(Click chart to enlarge)

RC27 (Runs Created per 27 outs) was in favor of the Slapsticks, with 7 of the top 8 leaders in that category.
RC Leaders
(Click chart to enlarge)

WPA (Win Probability Added) was also in favor of the Slapsticks taking the top 6 spots in that category.
WPA Leaders
(Click chart to enlarge)

It’s not possible from this exact run to know what sabermetric stat put the Slapsticks over the top as some (such as BABIP) were designed to be greater for the Slapsticks than the Sluggers. This simulation shows that OPS being equal, a singles hitter is more valuable in the end than a slugger, but it also shows that OPS, being a somewhat arbitrarily derived statistic, is not the defining stat to determine the value of a hitter or how that hitter might translate to team performance.