Tag Archives: Tom Tango

Why Babe Ruth Should Have Hit Leadoff

Most baseball fans have a good handle on what type of hitter should in which spot in the batting order. For instance, a speedster should hit leadoff, your big slugger hitting cleanup, etc. Tom Tango, Mitchel Lichtman, and Andy Dolphin in their book “The Book” provided statistical analysis to optimize a batting order. They based their analyses on the number of plate appearances and the frequency of base/out states (e.g. how often the cleanup hitter comes to bat with runners in scoring position).

I won’t go through all the explanation as Tango, Lichtman, and Dolphin did a much better job. If you don’t want to read the original source, Beyond the Box Score did a great job providing an overview and Bluebird Banter went through some of the statistical analysis.

We wanted to see how that analysis would transfer to actual wins and losses. We looked at two scenarios using the greatest leadoff hitter, Rickey Henderson, and the greatest hitter of all-time, Babe Ruth.

As we normally do, we used OOTP16 and created 9 teams filled with average clone position players and pitchers. Then we imported the 1982 version of Rickey Henderson and cloned him to make nine Rickey’s – one for each team. For each team, he hit in a different spot in the batting order (including the ninth spot – there was no DH in this league so the pitcher batted eighth on that team).

Then we simmed almost 2000 games for each team, and (WARNING!!!! MATH TERM!!!) checked the binomial probability of each winning percentage to see if it was significantly different than what you might see flipping a coin 2000 times.

Here are the winning percentages for when Rickey hit in each spot in the lineup and the result of the binomial distribution calculation:


Henderson

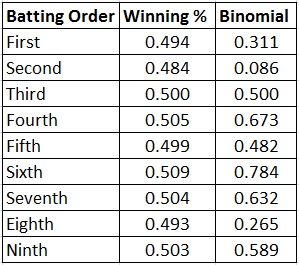
All values were not significantly different from a coin flip (a value of less than .050 would have meant they lost more significantly more games and a value greater than .950 would have meant they won significantly more games).

Surprisingly, the second spot in the batting order was the closest to being significant – but in the opposite way than expected, with the team losing more games than they won when Rickey hit second. The team performed the best when Rickey hit sixth.

So after almost 2000 games (more than 12 full seasons), it didn’t significantly matter where Rickey batted in the lineup. Each team’s win total was no different than what you might expect from flipping a coin 2000 times.

We did the same for Babe Ruth, using the 1921 version of Ruth that won our League of All-Time Greats. With Ruth, we found different results.

Ruth


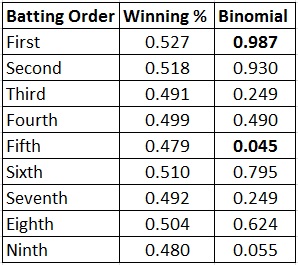
Hitting Ruth leadoff resulted in a significantly greater number of wins than expected by chance, due to the number of additional plate appearances by the leadoff hitter (4.66 PA/game as a leadoff hitter compared to 4.46 in the #2 spot, decreasing steadily down to 3.81 in the #9 hole).

Hitting Ruth second approached but did not meet the criteria for significance, while hitting Ruth 9th approached but did not reach significance for fewer wins than by chance. Surprisingly, hitting Ruth 5th did result in significantly fewer wins than expected over the course of almost 2000 games. We have no explanation for this, as Tango’s analysis says the number of plate appearances and the expected baserunner/out situations has the #5 spot as the fourth most important (after #1, 2, and 4).

Ruth’s RBI stats would have likely suffered by hitting him leadoff – in 12+ seasons he had 7% fewer RBIs than the Babe Ruth who hit 3rd and 18% fewer RBIs than the one who hit 4th – but the extra plate appearances would have likely led to marginally more home runs (4% more in our sim), and his relatively high on-base percentage would have had him on more for later hitters to bring in (the leadoff Ruth had 15% more runs).

Most  importantly hitting him in the leadoff spot might have meant even more wins for the Yankees.


You can follow us on Twitter @BullpenByComm

How well do wOBA and RC Predict Team Performance?

Okay, so we’ve already done two posts looking at OOTP leagues filled with clones of two players: Slappy Slapstick and Sluggish Slugger. One showed that Sluggish, the low BA guy with sexy power, got walloped head to head by Slappy, the unsexy high BA no power guy. The second showed the same in an MLB environment, but only when Slappy and Sluggish both had OPS high above the league average. Sluggish was better in the MLB environment when both had league average OPS.

These sims showed the limitations of OPS – the first big sabermetric stat to make its way into national telecasts – certainly lacks somewhat in being a robust stat to value all players. Being an arbitrary stat simply combining OBP with SLG it’s not surprising that it lacks robustness. So we went looking for something that might work better.

So we turned to wOBA (weighted On-Base Average). This stat, created by Tom Tango, is based on the common sense premise that all hits are not created equal. The stat uses aggregate league totals to weight the value of each method of getting on base (a good description of wOBA and how it is calculated can be found at FanGraphs).

Unfortunately, OOTP does not deal with wOBA, so transferring this to the Slappy/Sluggish universe took a little bit of work. First, we ran one season with Slappy and Sluggish and calculated the weights for wOBA using league totals, and modified the abilities of Slappy and Sluggish to make them equivalent in wOBA and equal to the wOBA from the previous season. This, by the way, gave a rather sizable advantage in OPS to the Sluggers (.887 to .799). Their attributes stats predicted a line for the Slappy’s of .347/.452/.799 with no HR. The Sluggers were designed to go .253/.303/.887 with 42 HR.

Then we set them loose on 5 seasons – after each season we restored the league back so as not to mess with the weights for wOBA which change from year to year.

In this universe, the results were much closer. Teams made up of Slappy’s won an average of 85 games a year with teams made up of Sluggish Slugger’s won an average of 77. While this still might seem an advantage for the Slappy’s, you have to keep in mind we took two very extreme players – the Slappy’s were give the lowest possible rating (1) for gap and power attributes. Teams made up of Slappy’s never hit more than 2 home runs in any single season (and while I didn’t bother to comb through the individual box scores I would not be surprised if they were all inside-the-park jobs). Also, to create a league made solely of these players (along with clones of the same average pitcher), would greatly amplify any differences between the two groups. In a MLB environment where there is a variation in terms of players’ skills, these differences would likely be noticeable at all.

Then we did the same with RC (Runs Created), created by Bill James. This is in thanks to a suggestion made by a member of the Baseball Sim Addicts!!! Facebook group. As with wOBA this took a little bit of tweaking but both Slappy and Sluggish were made to have an equivalent RC of 99. Slappy’s stat line was created to be .371/.491/.862 with Sluggish’s working out to .220/.332/.868. After running 5 additional seasons we came out with nearly the exact same overall results: Slappy’s teams finished with an average of 84 wins with the Sluggers finishing with an average of 78.

wOBA and RC certainly did a lot better at evening out the two teams. One could argue that a difference of 7 or 8 games in a simulation designed to greatly exaggerate any differences goes a long way in demonstrating the robustness of the two metrics. And even with these small but consistent differences they are the best metrics available when applied to a typical ML team. It does lead me to wonder though what is behind the small (and in the real world likely meaningless) advantage the Slappy’s have. Do the formulas need some minor tweaking? Is there something in the OOTP game engine?

Update: After a night of thinking about it, it likely has to do with fielding. All players were set to equivalent fielding ratings – but they were all average. Since the Slappy’s had a greater number of balls put in play, it allowed for more opportunities for errors. Looking back at the yearly stats the Sluggers did consistently produce more errors, some of which would have led to runs. While I cannot say for certain at this time, it would look like that could very well be the deciding factor between the two teams.